LpS 2014 Scientific Award Winner Article: New Binning Strategy for White LEDs
After having recognized the deficiencies of the ANSI binning strategy, which is based on the visually false magnification of MacAdam’s ellipses, Dr. Peter Bodrogi and Prof. Tran Quoc Khanh from the Technical University Darmstadt propose a new binning strategy based on a so-called semantic interpretation to describe and easily communicate the magnitude of acceptable chromaticity differences.
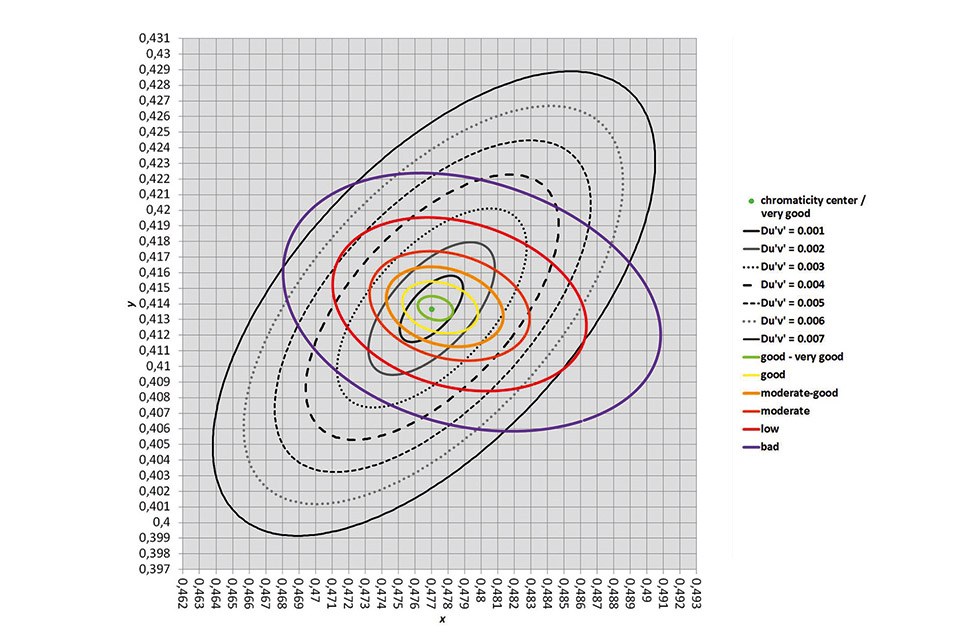
. Going off the center in any direction, contours indicate “good-very good” (green contour), “good” (yellow contour), “moderate-good” (orange contour), “low” (red contour) and “bad” (lilac contour) perceived color agreement with the center. Contours of constant chromaticity differences (Δu’v’=0.001 - Δu’v’=0.007 i.e. approximations of MacAdam ellipses) measured from the chromaticity center are also shown")
. For detailed explanations, see the caption of Figure 1")
The LED light sources of the luminaires to be used for interior lighting need an efficient i.e. visually relevant chromaticity binning strategy in order to achieve a certain target chromaticity and also to maintain good color homogeneity on white surfaces and on colored objects. For such a binning strategy, the magnitude of visually acceptable chromaticity differences shall be known. After having recognized the deficiencies of the ANSI binning strategy that is based on the visually false magnification of MacAdam’s ellipses, the authors of this paper suggest a new binning strategy to describe and easily communicate the magnitude of acceptable chromaticity differences. The new binning strategy assigns any instrumentally measured chromaticity difference expressed by a modern color difference metric (CAM02-UCS), a so-called semantic interpretation around any chromaticity center e.g. a target white point for the white LED light source. “Semantic interpretation” means that every chromaticity difference is interpreted by one of the following categories: “very good”, “good”, “moderate”, “low” or “bad” while “very good” means a “very good” agreement of perceived chromaticity between a target chromaticity and the actual chromaticity. The new binning strategy resulted from a series of visual experiments on the semantic interpretation of instrumentally measured color differences. Semantic interpretations are formulated in terms of natural language and represent a common basis of white LED binning communication between customers and manufacturers.
Introduction
Before the construction of a LED luminaire to be used for interior lighting, to achieve a certain target chromaticity and to maintain the color homogeneity of the luminaire, an efficient chromaticity binning strategy of the LED light sources is important. Chromaticity binning means the sorting of the LED light sources into chromaticity categories (so-called bins) after production. The question is the magnitude of visually acceptable chromaticity differences within a bin (i.e. the set of actual LED light sources to be installed in the luminaire) and also, between any LED light source inside the bin and a desirable target chromaticity, e.g. a visually preferred white tone.
The American National Standard ANSI ANSLG C78.377-2011 specifies white light chromaticities in terms of a set of binning ranges in the CIE 1931 x, y chromaticity diagram or in the CIE 1976 u’, v’ chromaticity diagram. ANSI binning categories are based on MacAdam’s ellipses that describe just noticeable (i.e. very small) color differences. From visual studies of literature it is obvious that a simple magnification of these ellipses without changing their shape and orientation cannot describe above-threshold (small to medium) color differences that are relevant for the practice of chromaticity binning. In this work, an advanced, visually relevant LED chromaticity binning strategy is presented in order to communicate the magnitude of chromaticity differences between the LED light source manufacturer and the producer of the interior lighting product.
New Binning Strategy for White LEDs
The new binning strategy assigns any instrumentally measured chromaticity difference a so-called semantic interpretation. The method can be applied to any chromaticity center (e.g. a desired target chromaticity of the LED light source like a certain cool white tone) and to any direction in the chromaticity diagram. The concept of semantic interpretation means that, depending on the chromaticity center and the direction in the chromaticity diagram, every chromaticity difference is interpreted by one of the following semantic categories: “very good”, “good”, “moderate”, “low” or “bad”, or by the aid of intermediate categories like “moderate-good”. E.g. “very good” means a very good agreement of perceived chromaticity between the center in the chromaticity diagram (i.e. the target chromaticity to be achieved by the LED light source) and the actual chromaticity of the LED.
The new binning strategy is based on the result of a series of visual experiments on the semantic interpretation of instrumentally measured color differences [1]. These color differences were expressed in terms of the visually uniform so-called CAM02-UCS color difference metric (ΔE’) [2]. Observers of this study [1] were asked to follow a very critical and demanding attitude in the context of a color inspection task and interpret color differences between numerous pairs of colors by the aid of the above semantic categories. As mentioned above, every ΔE’ value was assigned a semantic interpretation in the previous study [1]. The agreement between the two color stimuli was assigned the category “very good” if ΔE’ was equal 0.00, “good-very good” for ΔE’=1.05; “good” for 2.07; etc.
The CAM02-UCS color difference metric is more reliable than the using of multiples of MacAdam’s ellipses (e.g. 1-step, 2-step, 7-step MacAdam ellipses). The reason is that MacAdam’s experiments were based on chromatic adaptation to a single chromaticity (daylight), on a single observer and only on the measurement of just noticeable color differences. The upscaling of these just noticeable color differences (e.g. 7-step MacAdam) tends to cause unpredictable visual errors. The CAM02-UCS metric, however, was designed to predict the whole range of magnitude of color differences relevant to white LED binning.
The method of the new binning strategy transforms every value of the CAM02-UCS color difference metric (ΔE’) into the CIE 1931 x, y chromaticity diagram around any chromaticity center in any direction. Then, the semantic contours of “very good”, “good”, “moderate”, “low” or “bad” agreement with the chromaticity of the color center are computed in every direction around the color center. Within the areas between neighboring semantic contours in the CIE 1931 x, y chromaticity diagram, the nearest category to the considered chromaticity point shall be applied.
Result and Discussion
Semantic contours of the new binning strategy are shown in the CIE 1931 x, y chromaticity diagram of Figure 1 for a warm white chromaticity center, the Planckian radiator at 2500 K, x=0.4770; y=0.4137. Semantic contours are compared with contours of constant chromaticity differences (Δu’v’=0.001 - Δu’v’=0.007) in the u’-v’ diagram measured from the chromaticity center. These constant Δu’v’ contours approximate 1-step to 7-step MacAdam ellipses (i.e. MacAdam ellipses magnified 1x to 7x).
As can be seen from Figure 1, the orientation of the constant Δu’v’=0.001 - Δu’v’=0.007 contours and the orientation of the semantic contours is different. At this chromaticity center (x=0.4770; y=0.4137), the different shades of white (i.e. the different white points) along the Δu’v’=0.001 ellipse may correspond to “good-very good”, “good” or “moderate-good” color agreement with the center (the light green point i.e. the target white point), depending on direction, see the intersection points of the Δu’v’=0.001 ellipse (black curve) with the green, yellow and orange semantic contours in Figure 1.
Semantic contours of the new binning strategy are shown in the CIE 1931 x, y chromaticity diagram of Figure 2 for a phase of daylight at 6000 K, x= 0.3216; y=0.3377. Semantic contours are compared with contours of constant chromaticity differences (Δu’v’=0.001 - Δu’v’=0.007) in the u’-v’ diagram measured from the chromaticity center.
As can be seen from Figure 2, the orientation of the Δu’v’=0.001 - Δu’v’=0.007 contours and the orientation of the semantic contours is similar. At this chromaticity center (x=0.3216; y=0.3377), the different white tones along the Δu’v’=0.001 ellipse (black) correspond approximately to “good-very good” agreement with the center (the green curve exhibits a similar course as the black ellipse). The different white tones along the Δu’v’=0.002 ellipse may correspond to “good” or “moderate-good” color agreement with the center (the light green point i.e. the target white point), depending on direction, see the intersection points of the Δu’v’=0.002 ellipse (grey) with the yellow and orange semantic contours in Figure 2.
Conclusions
In this paper, the deficiencies of the ANSI binning strategy resulting from the use and magnification of MacAdam ellipses were pointed out. The proposed new binning strategy for white LEDs uses an updated color space (CAM02-UCS) and easy-to-understand binning categories, e.g. “very good”. Extending the method to non-white chromaticity centers, the color homogeneity of colored objects can also be characterized. Advantages of the new binning strategy compared to ANSI binning include that the semantic contours corresponding to “good-very good”, “good”, etc. visual agreement of the considered white LED chromaticity with the chromaticity of the center (target white chromaticity) carry a straightforward meaning because these categories are formulated in terms of everyday language (e.g. “good”) instead of using a multiple of the size of an (approximated) MacAdam ellipse. Semantic categories of color similarity communicate the magnitude of chromaticity differences between the LED light source manufacturer and the producer of the interior lighting product effectively.
References:
[1] Peter Bodrogi, Stefan Brückner, Nathalie Krause, Tran Quoc Khanh, Semantic Interpretation of Color Differences and Color Rendering Indices, Color Res. Appl. 39, pp. 252–262, 2014
[2] M. R. Luo, G. Cui, Ch. Li, Uniform color spaces based on CIECAM02 color appearance model, Color Res. Appl. 31, pp. 320–330, 2006
