Lifetime Calculation of White HP-LEDs from 16,000 Hours Aging Data
Accurate models are a relevant tool for correctly calculating the so-called useful lifetime predictions of LED lighting products. Until recently, only the efficiency decay and related reduced lumen output was taken into account. Max Wagner, Research Assistant, TU Darmstadt, and his co-authors, Alexander Herzog, Hristo Ganev, and Prof. Tran Quoc Khanh asked themselves if there are other lifetime limiting factors that can be modelled and predicted. Their findings showed that color shift might be more critical and in the following, propose a method to simulate and predict this behavior.
Based on the LM 80 testing standard method, the lumen maintenance of LED packages is measured during their lifetime. Ten measuring objects always run in one condition that is defined by temperature and forward current. The optical power is taken as a further criterion for aging analysis because it has a close relation to the total spectral emission. The results show that differences in the luminous flux and optical power occur during the aging test. The spectral emission of LED packages changes over time. This effect leads to a visible color shift that should be taken as a new criterion for the lifetime. Extrapolation inspections show that it is possible to find mathematical functions that correspond to the behavior of the color shift. Predictions of the color shift can be done taking early aging data and calculating them into the future. This method allows a prediction up to four times the test duration in the future. Furthermore, the author talks about relevant aging mechanisms and their dependency on the driving parameters.
Introduction
In the last years the most important parameter of LED packages was the luminous efficacy. As there has been a high increase in efficiency, new properties like color stability are coming into focus. The author contrasts these two views of aging analysis. Besides the extrapolation methods of IES TM-21 for luminous flux, an extrapolation for the color shift in u’v’-coordinates is introduced. For every package technology (high power, medium power, chip-on-board) other aging mechanisms play the main role. Since the investigated packages are based on the principle of phosphor conversion, a deeper look into aging mechanisms in the silicone-phosphor region has been done.
Measurement System
The investigation of aging mechanisms of high-power converted phosphor LEDs is performed under internationally accepted methodology, the IES LM-80-08. The necessary conditions and standards are fulfilled in our test setup in regard to operation currents and applied case temperatures TC. Two types of test samples (LED type A and B) were measured in a 30 cm integrating sphere in combination with a high precision spectroradiometer. The measurement of the LEDs is taken at a 20 ms pulsed operating current at stabilized case-temperature TC of 25 °C. These conditions ensure a negligible influence of self-heating effects during the measurement. Furthermore, reference LEDs are used to avoid measurement inaccuracies of the system caused by dust inside the integrating sphere or aging of the spheres coating. To determine aging mechanism in dependence of the LEDs structure, two types of light-emitting diodes produced by different manufacturers were used in the test setup. Both samples have a CCT of 4000 K and a CRI > 80. Every LED-type was aged under different operating conditions, the current was set to 350 mA, 700 mA and 1000 mA, while the case temperature was stabilized at 55°C, 85°C and 95°C. Every test condition was performed with 10 LED samples up to 16,0000 hours.
Results
Luminous flux and TM 21 method
The TM-21 method [1] uses the luminous flux as an aging parameter. The degradation to 70% or 80% is the defined end of lifetime. Since the luminous flux is calculated with the V(λ)-function, spectral changes in the blue and red area are not represented as much as changes in the yellow or green area. So the total optical degradation cannot be described by the luminous flux Φv, especially if the form of the spectrum changes. To get all the emitted visible light, the radiant flux is chosen that includes all spectral ranges without a weighting function. Figure 1 shows the aging behavior of an LED package (type A) up to 16,000 hours.
") Figure 1: Luminous and optical flux for an LED package up to 16,000 hours (1000 mA, 95 °C)
Figure 1: Luminous and optical flux for an LED package up to 16,000 hours (1000 mA, 95 °C)
The blue and red curves separate from each other because the form of the spectrum changes over time. This spectral change is shown and analyzed later in detail.
The aging curve itself can be described by the following equation:
Φ(t) = (Φ0 - ΦE) ∙ e-αt + ΦE
The formula is an exponential function, with an additional offset to the standard TM-21 function. The analysis at 16,000 hours shows a run towards a value so it is hard to extrapolate very far into the future. The lifetime of L80 was reached at 12,000 h for the radiant flux and will very likely reach it at 18,000 hours for the luminous flux.
Radiant flux at three temperatures
The results of the aging behavior of LED type B are very different. Figure 2 shows the mean and median values of the radiant flux for a fix current of 1000 mA and three temperatures.
 at 16,000 hours (1000 mA, 55°C, 85°C and 95°C)") Figure 2: Mean and median values for 10 LED samples (LED type B) at 16,000 hours (1000 mA, 55°C, 85°C and 95°C)
Figure 2: Mean and median values for 10 LED samples (LED type B) at 16,000 hours (1000 mA, 55°C, 85°C and 95°C)
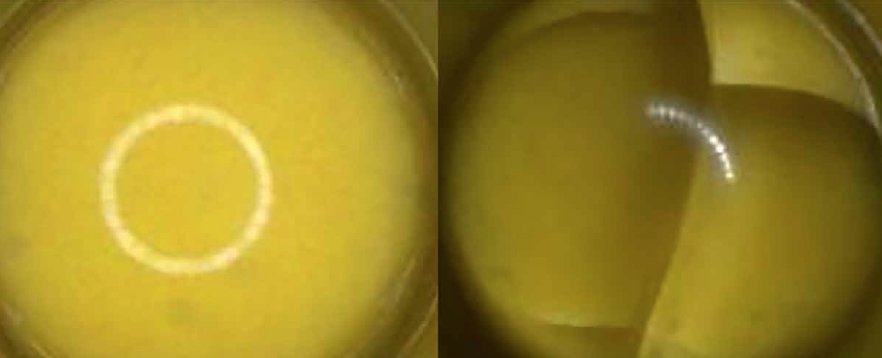
There are only small differences between the mean and median values, so the distribution does not get skewed by time. The first 2,000 hours probably contain healing effects of the crystal structure [2], which let the radiant flux rise. After the first 4,000 hours the values decrease in all conditions. There is a clear influence of the temperature (green and blue curve), a difference of 30°C leads to an average decrease of more than 10% by 16,000 hours. A further increase to 95°C results in a curve that has a step between 6000 h and 8000 h. A microscopic view (Figure 3) shows cracks in the silicone cap.
 and after 7000 hours of aging at 1000 mA / 95°C (right)") Figure 3: Silicone cap at 0 hours (left) and after 7000 hours of aging at 1000 mA / 95°C (right)
Figure 3: Silicone cap at 0 hours (left) and after 7000 hours of aging at 1000 mA / 95°C (right)
This geometric change leads to a different light extraction, in comparison to the samples at other conditions. That is why a direct comparison of the blue and red curve with regard to extrapolation is not meaningful. The results of the extrapolation with TM-21 show a higher lifetime for the lower temperature.
Spectral changes
Normalized to the blue peak of the spectrum, there is a significant change in the phosphor-converted emission band (Figure 4).
 by 16,000 hours at 1000 mA / 95°C") Figures 4: Spectral change of an LED package (LED type A) by 16,000 hours at 1000 mA / 95°C
Figures 4: Spectral change of an LED package (LED type A) by 16,000 hours at 1000 mA / 95°C
The absolute values of the measured data, which are not presented here, indicate a loss of radiant flux in the blue spectral region and the phosphor-converted emission with different rates of change. To investigate the spectral changes in colorimetric aspects, the spectrum is divided in two spectral bands. The blue one is defined with an integral of radiant flux from 380 nm to the local minimum at 470 nm, the yellow band is set analogous between 470 nm and 780 nm.
The reason why there is a shift to warmer light is a delamination and cracking of the phosphor-silicone plate on top of the chip, which can be observed by a microscope. The interface changes and the blue light have an increased optical path through the plate. Hence, more light is converted from blue to yellow. Similar effects were noticed at other high power LEDs [3] as well.
 at 95°C and three currents") Figure 5: Ratio of yellow to blue for an LED package (type A) at 95°C and three currents
Figure 5: Ratio of yellow to blue for an LED package (type A) at 95°C and three currents
Color shift
The same LED package was used to look at spectral ratios for one temperature (95°C) and three currents (350, 700, 1000 mA). For every current the ratios rise by time, but with a different velocity. The lines are the direct connections between the first and last point and correspond to the mean slope of the ratio change for every condition.
Since the spectral change is happening because of the transformation of the phosphor layer, it is helpful to know the temperature in this part of the LED package. A higher current means a higher optical radiation that is converted into heat in the phosphor layer. A direct examination of the temperature is very difficult, because of the silicone cap, which represents a barrier for thermo graphic measurements. That is why a simple model estimates the temperature by following formula with k as a temperature coefficient.
Tx = Tc + k · I
The resulting temperatures of three different coefficients are shown in the following table.
Every process that is accelerated by temperature can be approached by the Arrhenius method. The semi logarithmic diagram of the parameter to be studied (ration m) over the inverse temperature (1/T) should lead to straight lines. Figure 6 shows three Arrhenius graphs for three currents and the resulting phosphor temperatures of table 1.
 Table 1: Estimated temperature of the silicone-phosphor layer at different forward currents
 for different temperatures") Figure 6: Arrhenius graphs for an LED package (LED type A) for different temperatures
Figure 6: Arrhenius graphs for an LED package (LED type A) for different temperatures
The blue points represent the lowest temperatures as the inverse temperature is represented on the x-axis. Activation energies EA can be determined out of the slopes, the absolute temperature and Boltzmann constant. Depending on the estimated temperatures, they are in a range from 0.3 eV to 0.5 eV. That is why the exact temperature is very important for knowing the real aging mechanism’s activation energies. One presumption is that the silicone matrix gets brittle over time. Accelerated aging tests of silicone encapsulant show that the elongation at breaks decreases by the factor of 10 after 4,000 hours at 225°C [4].
Extrapolation of color shift
In comparison to the method of TM-21 for luminous flux, an extrapolation of the color shift in u’v’-coordinates has been studied with other mathematical functions. Figure 7 shows the CIELUV values by 16,000 hours.
 with root functions") Figure 7: Extrapolation of color shift (LED type A) with root functions
Figure 7: Extrapolation of color shift (LED type A) with root functions
Interesting parameters of lighting are the u’v’-coordinates, which can be taken to describe the color shift. Again LED type A is chosen at three temperatures and currents. The hardest condition (1000 mA, 95°C) shows the best results. The fitted function represents the values very well. As there are different start times of the strong increase of the color shift, the equation contains a Heaviside step function, so that the starting point can be calculated as the parameter d. The form of the curve can be adapted by the parameter a.
Δu’v’(t) = Θ(t-d) · a · t 0.25+ c
Even an extrapolation based on three points of the beginning (2,000 h - 4,000 h) ends up at the measured u’v’ coordinates at 16,000 hours for different LED packages. All functions are plotted up to 50,000 hours.
Conclusions
The influence of current (350, 700, and 1000 mA) and temperature (55, 85, and 95°C) on the aging behavior of the LED packages is investigated over 16,000 hours. The measured aging curves depend on the type of the package and do not always show smooth courses. Especially if new aging effects caused by cumulating processes start during the test, the data show a noticeable answer to that.
One main driving factor for the color shift is the forward current. It has a nearly proportional impact on the radiation that stresses the silicone and phosphor lying above the LED die. It can be shown that the phosphor plate is delaminating after some time. By using Arrhenius graphs the activation energy gives a hint of the process that is accelerated by temperature. Therefore the different temperatures in the package must be considered separately. Further research should guarantee a more precise determination of the relevant temperature for Arrhenius calculations. Extrapolation inspections show that it is possible to find mathematical functions that correspond to the behavior of the color shift.
Comparing the reached borders of lifetime for luminous flux (L80) and color shift (Δu’v’=0.0054), a clear consequence comes out of our investigations: for some measuring objects the main problem for the LED package’s lifetime is the color shift. The determination of color coordinates only requires a relative spectrum of the LED and can be measured by small, hand held devices. So it could be possible to analyze the color shift of more products without complex laboratory equipment.
Acknowledgements:
The authors want to thank to the German Federal Ministry of Economic Affairs and Energy for the financial support of the project.
References:
[1] IES TM-21-11: “Projecting Long Term Lumen Maintenance of LED Light Sources”, July 2011
[2] Yang, Y. et al., “Acceleration Factor Analysis of Aging Test on Gallium Nitride (GaN)-based High Power Light- emitting Diode (LED)”, 14th IEEE ITHERM Conference, 2014
[3] Tuttle, R., “Method for Projecting Color Shift of High Power LED Packages”, 4th LpS, Bregenz, 2014
[4] McDonald, J., “Advanced Silicone Materials for LED Lighting”, DOE SSL R&D Workshop 2015
