A New Approach for Fast and Accurate Measurement of Light Emitting Diodes Junction Temperatures
LpR 73 Article, page 48: Junction temperature of LEDs is one crucial parameter to being thoroughly observed. In this paper, Ahmet Mete Muslu, Onuralp Isil and Prof. Mehmet Arik from the Energy Efficient Electronics and Lighting Technologies Center (EVATEG), Department of Mechanical Engineering at the College of Engineering Ozyegin Universitywill at first describe the importance of Tj for LED systems including RGB and white LEDs. Then they will present techniques from literature and recently in-house developed novel methods and a new Junction Temperature Measurement Device (EVAtherm). Results in selected general lighting and automotive lighting applications will be demonstrated.
Although light emitting diodes (LEDs) offer unique advantages, excessive heat generation and the rise in the junction temperature result in a significant drop in efficiency, lifetime and the light output of LED chips. While the determination of junction temperature is very critical to characterize the performance of LEDs, junction temperature measurements with current systems pose some challenges, such as high uncertainties, high cost leading to limited affordability, and limited user functions. Thus, development of a novel junction temperature measurement device that offers fast and accurate results with cost-effective solutions is needed for companies aiming for developing future lighting technologies. Thus, this article introduces an in-house developed junction temperature measurement device with a number of unique advantages. In order to show the functionality of the device, the impact of junction temperature over optical and electrical properties of high power RGB LEDs is investigated in the current study and the measurement system is introduced. Results show that junction temperature of RGB LEDs can be easily and quickly measured with high accuracy.
Introduction
After many years of use, traditional lighting sources are rapidly replaced by LEDs (light emitting diodes), which offer high efficiency, long lifetime, environmentally friendly use, high durability and various color options [1, 2, 3]. However, LEDs have some limitations just like all other electronics, and thermal problems caused by heat generation over the junction region of LEDs are among the most important. As observed in almost all electronics, only a portion of the electrical energy applied to the LEDs can be used and the remaining energy (around 70%) is lost as heat and causes the increase in junction temperature [4]. This temperature increase leads to a drop in the performance and lifetime of the LEDs. As a result of experimental findings, it was concluded that if the junction temperature of LEDs is kept under some limits, long life span as much as 50,000 hours can be provided by LEDs [5]. Therefore, it is very important for professionals both in industry and academia to address thermal issues in LED products by conducting accurate measurements of the junction temperature of LEDs.
The current junction temperature measurement systems operate based on the transient measurement technique [6, 7, 8]. However, in recent years, global users who want to measure the junction temperature find these products very expensive and their feedback in terms of the reliability of the measurements raise some concerns. Therefore, in order to realize thermal characterization of LED products, there is a need for a junction temperature measurement system that offers accurate, reliable, fast and inexpensive solutions to the parties in industry and academic environments.
Junction temperature measurements of existing measurement devices on the market rely on layer by layer determination of the thermal characteristics of an LED package. In these products, thermal capacity and thermal resistance values of different LED components are determined [9]. The first step for thermal resistance measurement is to obtain the time dependent heating curve of the LED. In this method, sampling and data collection speed of the device should be quite high in order to obtain the heating curve of the LEDs. At the same time, high measurement frequency and accuracy is required since complex calculations such as convolution, inversion and Fourier transform are required for the calculation of the structure function, which defines the relationship between thermal resistance and thermal capacity.
Measurement devices based on the transient measurement technique produce information including thermal resistance, heat flow path, properties of thermal interface material first, other than measuring the junction temperature directly. As a result of the complexity of the device, the increased cost makes these products quite expensive. In fact, high sampling rate and data acquisition resolution of these devices are more than necessary for users who want to measure the junction temperature only [10]. In the study, it is stated that a 1 ms resolution time is ideal for junction temperature measurements of an LED package.
In addition, the measurement results obtained using the transient measurement technique is based on the one-dimensional heat flow path assumption in the LED package. However, the presence of LED components such as phosphors and lens often interfere with the symmetrical spread of the heat flow [10, 11] and the junction temperature measurements with one-dimensional assumption may not be reliable, especially for white LEDs and LEDs with an asymmetric structure. In addition, since the actual thermal resistance is obtained by determining heat generation in the package with the subtraction of radiant power from electrical input power, radiometric systems are needed to determine radiant power of LEDs and thermal resistance of the package. Therefore, the thermal resistance values determined without radiometric measurements can be defined as a reference thermal resistance other than the actual one [10]. Measurement devices that do not incorporate the radiometric measurements of LEDs are suspicious in terms of characterizing thermal resistance of LED packages.
The measurement system developed by the EVATEG Center does not have the requirements for time-dependent measurements, and the thermal resistance versus thermal capacitance calculations. Instead of short-term based measurements, the calibration measurements performed in a stable and thermal equilibrium condition eliminate the costly processes of the previous devices. In this respect, instead of a duration of 1 µs, measurement data is collected with a sampling rate of 1 ms. The suitability of this timing has also been demonstrated in an earlier study conducted at the EVATEG Center [12]. Since the measurements do not focus on direct determination of thermal resistance, applications that increase the measurement uncertainty such as determining the thermal conductivity of the thermal interface material are also avoided. In addition, since junction temperatures of LEDs are measured with the forward voltage values obtained in the steady state and thermal equilibrium conditions, one dimensional (1D) heat flow assumption is not made. In this respect, junction temperature, which is the main parameter of interest for the LEDs is measured reliably and automatically without increasing the cost.
Description of the New Junction Temperature Measurement System
In many industrial applications, thermal characterization and performance evaluation of LEDs are done by measuring the temperature of the nearest solder point on an electronic card instead of junction temperature. Since the optical behavior is directly influenced by the junction temperature, evaluations of performance, light and color properties and lifetime based on the solder point temperature cause considerable errors. On the other hand, companies using systems that can measure junction temperature in a less costly and reliable manner will make a big difference on an international scale in terms of product quality and measurement reliability, considering the rapidly increasing number of energy efficiency related projects. With this in mind, EVATEG Center produced a novel junction temperature measurement device for various parties in the sector who are LED manufacturers, designers, optical engineers and users who wish to perform thermal and optical characterization of LEDs for any reason. In this sense, lighting, automotive, TV, tablet and electronics manufacturers come to the fore.
It is strongly believed that the introduced device will fill a significant gap in the market. In fact, a significant reduction in cost of the measurement device will enable many companies in the lighting and electronics industries to access the device and improve the performance of their products. This device will also greatly contribute to energy savings because it sheds light on the performance parameters of LEDs. Compared to commercially offered systems, this high-quality device in terms of price and performance will provide new opportunities for many international companies to develop high-performance technologies.
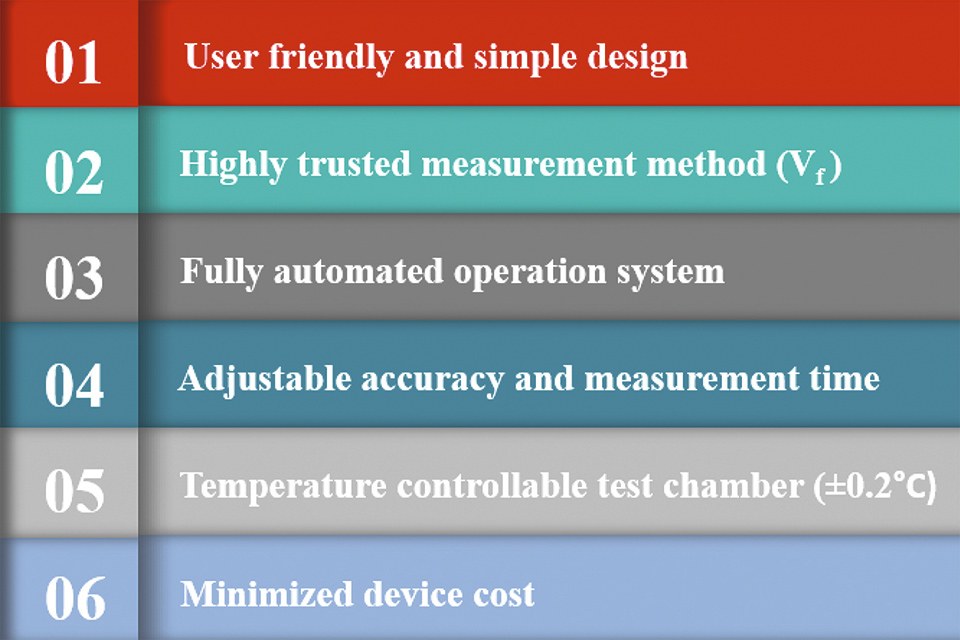
Considering the operation technique, the new system quickly determines the relationship between the junction temperature and the forward voltage of an LED chip at the steady state and thermal equilibrium conditions in the first phase of the measurements. Then, the junction temperature of an LED chip operated at a certain driving current is measured without making a one-dimensional heat flow assumption [13]. This is very important since the LED chip and package designs as well, push towards higher lumen extraction driven by higher electrical current conditions and result in 3D heat transfer at the LED chips. Therefore, 1D assumption will produce high uncertainties and may lead to catastrophic system failures. In all steps, the measurements will be performed without requiring any intervention by the user. In addition, the measurement accuracy of a test can be adjusted by the user, and this gives a user a considerable amount of flexibility. In this sense, a user can set the required test conditions in a measurement including ambient temperature in the test chamber, sensitivity of chamber temperature and forward voltage readings of LEDs, pulse and driving currents etc. Thus, depending on the limitations for measurement time, the user can adjust the measurement conditions to ensure fast and accurate measurements. In this way, the desired linear relationship between the junction temperature and forward voltage is provided in the measurement software. The measurement unit and the measurement capabilities are given respectively in Figure 2 and Figure 3.
 Figure 2: Working capabilities of the developed junction temperature measurement device
 Figure 3: Graphics of the system with RGB LEDs inside the test chamber
In order to demonstrate the functionality of the introduced device, the performance of high-power red, green and blue (RGB) LEDs was evaluated with the junction temperature measurements conducted in it. Change in forward voltage and electrical power with junction temperature, the drop of conversion efficiency and lumen per watt value of LEDs with driving current and junction temperature are examined in the next section to show the intended use of the current system.
Results and Discussions
Commercial high power red, green and blue LEDs (CREE XLamp XP-E2 [14]) were used to observe junction temperature behavior of LEDs and its interactions with optical and electrical properties. Measurements were initiated with the calibration of RGB LEDs in the system and the calibration equations were derived to create a relationship between junction temperature and forward voltage for each LED type. Calibrations tests were conducted at various steady state temperatures of the test chamber and LEDs were pulsed with 1 milliampere (mA) current for 1 millisecond (ms) to determine the corresponding forward voltage values at various chip temperatures of LEDs without causing considerable heat generation over the junction region of LEDs. Comparison of RGB LEDs in terms of junction temperature versus forward voltage drop behavior was made with the calibration results as seen in Figure 4. As a result, it has been determined that the highest drop in forward voltage is observed in green LEDs while the blue LED has a little less change in forward voltage compared to the red LED.
 Figure 4: Forward voltage drop behavior of RGB LEDs with junction temperature
After characterizing the variation of junction temperature with forward voltage of LEDs, junction temperature measurements were conducted for each LED at the steady state condition for driving currents of 200, 350 and 500 mA. When steady state is reached, driving currents were shifted to 1 mA for 1 ms duration and the corresponding forward voltage was read and plugged into the calibration equations to determine junction temperature at each driving current. Electrical input powers at each operating current were also determined for RGB LEDs at the steady state condition. The change in junction temperature with electrical input power is shown in Figure 5 for each LED type.
It is observed that green and blue LEDs show a similar behavior in terms of forward voltage at three driving currents; thus, very close electrical input powers were measured for green and blue LEDs. However, junction temperature measurements have shown that heat generation over junction region of green LEDs is significantly higher than the blue LEDs. Therefore, it can be understood that thermal issues arisen in green LED packages are more critical compared to the blue LEDs and better cooling solutions need to be developed since the optical properties are critically affected.
On the other hand, the forward voltage values of red LEDs are significantly lower at the same driving currents (200, 350 and 500 mA) in comparison with green and blue LEDs. Despite the significant difference in electrical input powers, the junction temperatures of red LEDs are slightly lower than blue LEDs. Thus, it can be said that blue LEDs are operating more efficiently considering the overall range of electrical input powers.
 Figure 5: The change in junction temperature of RGB LEDs with electrical input power
After understanding the forward voltage and electrical input power behavior of LEDs with junction temperature, the alteration of conversion efficiency with junction temperature was investigated for RGB LEDs. Conversion efficiency of LEDs refers to the fraction of total radiant power to the electrical input power of LEDs. Thus, an Integrating Sphere System was utilized in order to measure the total radiant power of LEDs operating in steady state conditions at 200, 350 and 500 mA currents. The relationship between junction temperature and conversion efficiency of RGB LEDs was created as shown in Figure 6. It is found that conversion efficiency of red LEDs is slightly higher at junction temperatures below approximately 40°C while blue LEDs are more efficient at electrical conditions of their standard use. In addition, conversion efficiency of green LEDs is expected to be higher than red LEDs at junction temperatures over 74°C. As a result, conversion efficiency of red LEDs is most affected by the change in junction temperature.
 Figure 6: Change in conversion efficiency of RGB LEDs with junction temperature
Thermal, optical and electrical interactions of RGB LEDs are also characterized in Figure 7 at driving currents of 200, 350 and 500 mA. Since a higher lumen output is always desired by LED users, it is critical to understand how LPW value of RGB LEDs is affected by junction temperature. The results have shown that lumen per watt values of LEDs are reduced by around 37%, 41% and 33% respectively for red, green and blue LEDs as the operating current is increased from 200 mA to 500 mA. It was also realized that although the highest junction temperatures are measured in green LEDs, the highest lumen outputs are also obtained with green LEDs. This shows that if green LEDs are cooled effectively, the blue LEDs which are composed of the same semiconductor material as green LEDs may be replaced by green LEDs in applications where similar functionality is required.
 Figure 7: Thermal, optical and electrical characteristics of RGB LEDs at three driving currents
Summary and Conclusions
In this study, an in-house developed junction temperature measurement device was introduced and thermal, optical and electrical characterization of RGB LEDs performed in this system are demonstrated. Compared to commercially offered alternative systems, high prices ranging from 50,000 to 150,000 USD, the EVAtherm is a product that can be reached by a broad audience of scientists, engineers and companies with an approximate price of 40,000 USD and it will offer fast and reliable junction temperature measurements for LEDs. Thus, optical engineers, scientists and other professionals using this system will be able to characterize thermal performance of their photonic devices. With the reliable thermal data, they will have a chance to address thermal issues of their products and improve their performance in terms of thermal, optical and electrical characteristics.
In the study, junction temperature measurements of RGB LEDs give significant insights about how forward voltage drop, electrical input power, conversion efficiency and luminous efficacy values of LEDs are affected by heat generation over the junction. The differences in results are attributed to the use of different active layers in RGB LEDs. It has been shown that all optical and electrical traits of LEDs are negatively affected by the rise in junction temperature and there is a significant potential to improve the performance of LEDs considering the highest conversion efficiency of 32% for blue LEDs at the nominal driving current (350 mA). Thus, it is strongly believed that the proposed measurement system in this study will contribute to the development of highly efficient systems of future lighting technologies.
Acknowledgement:
The authors would like to thank to Turkish National Science Foundation (TUBITAK) for the financial support provided for the current program under contract number 217M357 and EVATEG Center at Ozyegin University for enabling the use of experimental facilities.
References:
[1] Luo, X., Hu, R., Liu, S., and Wang, K., 2016, "Heat and fluid flow in high-power
LED packaging and applications", Progress in Energy and Combustion Science,
56, 1–32
[2] Muslu, A., M., Ozluk, B., and Arik, M., "A Comparative Study on the Impact of
Junction Temperature over Thermal, Optical and Electrical Traits of High Power
Red Light Emitting Diodes (LEDs)", ASME Journal of Electronics Packaging
(JEP), 2019 (Proceedings)
[3] Ramos-Alvarado, B., Feng, B., and Peterson, G. P., 2013, "Comparison and
optimization of single-phase liquid cooling devices for the heat dissipation of
high-power LED arrays", Applied Thermal Engineering, 59(1-2), 648–659
[4] X. Luo, R. Hu, S. Liu, and K. Wang, 2016, "Heat and fluid flow in high-power
LED packaging and applications", Prog. Energy Combust. Sci., vol. 56, pp. 1–32
[5] Chen, K.-L., Chan, H.-P., Hung, Y.-C., and Shieh, S.-H., 2016, "A Smart LED
Lighting with Multiple Dimming and Temperature Automatic Protection
Capabilities", International Symposium on Computer, Consumer and Control (IS3C)
[6] Luo, Y., 2012, "Use Isothermal Surface to Help Understanding the Spatial
Representation of Structure Function", Transactions of The Japan Institute of
Electronics Packaging, 5(1), 63–68
[7] Juntunen, E., Tapaninen, O., Sitomaniemi, A., and Heikkinen, V., 2013,
"Effect of Phosphor Encapsulant on the Thermal Resistance of a High-Power
COB LED Module", vol. 3, no. 7, pp. 1148–1154
[8] Yang, L., Wei, and B., Zhang, J., 2012, "Transient thermal characterization of
organic light-emitting diodes", Semiconductor Science and Technology, 27/10, 105011
[9] Lee, D., Choi, H., Jeong, S., Jeon, C. H., Lee, D., Lim, J., Byon, and C., Choi,
J., 2018, "A study on the measurement and prediction of LED junction
temperature", International Journal of Heat and Mass Transfer, 127, 1243–1252
[10] Hanß, A., Schmid, M., Liu, E., and Elger, G., 2015, "Transient thermal analysis
as measurement method for IC package structural integrity Transient thermal
analysis as measurement method for IC package structural integrity",
Chinese Physics B, Volume 24, Number 6
[11] Juntunen, E., Tapaninen, O., Sitomaniemi, A., and Heikkinen, V., 2013,
"Effect of Phosphor Encapsulant on the Thermal Resistance of a High-Power
COB LED Module", IEEE Transactions on Components, Packaging and
Manufacturing Technology, 3(7), 1148–1154
[12] Tamdogan, E., Pavlidis, G., Graham, S., and Arik, M., 2018, "A Comparative
Study on the Junction Temperature Measurements of LEDs With Raman
Spectroscopy, Forward Voltage Methods", IEEE Trans. Components,
Packag. Manuf. Technol., vol. 8, no. 11, pp. 1914–1922
[13] Muslu, A. M., Ozluk, B., Tamdogan, E., and Arik, M., 2017, "Impact of junction
temperature over forward voltage drop for red, blue and green high power light
emitting diode chips",16th IEEE Intersociety Conference on Thermal and
Thermomechanical Phenomena in Electronic Systems (ITherm)
[14] CREE XLamp XP-E2 LEDS, Online source:
www.cree.com/led-components/media/documents/XLampXPE2.pdf
