Al2O3 Coated Europium- Activated Aluminum Silicon Nitride for COB LED Technology by the Graz University of Technology and Tridonic Jennersdorf
Eu2+ activated nitride phosphors have drawn much interest for solid state lighting because of their interesting photoluminescence. While they show excellent optical properties, they are hygroscopic and have the potential of being degraded by atmospheric moisture and high temperatures. A coating layer on the surface is an effective method to improve stability against moisture and oxidation. For use in chip on board technology, Nika Mahne, master student at the Institute of Inorganic Chemistry, A. Reichmann, B. Bitschnau, R. Fischer, from the Graz University of Technology, and F. Schrank from Tridonic Jennersdorf propose an approach where a CaAlSiN3:Eu2+ [1, 2, 3] phosphor was coated with Al2O3, obtained via a Brønsted precipitation reaction based on a solution-coating process from a mixture of aluminum halide with a base after annealing at a temperature of 400°C.
Eu2+ activated nitride phosphors like CaAlSiN3:Eu2+ offer interesting photoluminescence properties [1]. Among Eu2+ doped red nitride phosphors used in solid state lighting, CaAlSiN3:Eu2+ was found to show excellent optical properties because of adequate thermal stability, lack of environmental hazard, non-toxicity, high emission efficiency and high quenching temperature [2]. However, these materials are hygroscopic and have the potential to be degraded by atmospheric moisture and high temperatures under operation [3]. One of the effective methods to improve its stability is to create a coating layer on the surface of the phosphor particles [4]. The coating should be optically transparent, and a precise quantity of coating must homogeneously cover the surface of the individual phosphor particle [5]. Therefore, inorganic materials such as Al2O3 are usually chosen to act as a coating layer on the surface of phosphors [5].
Experimental
 Table 1: Preparation of aqueous solutions for the coating experiments
1 g of uncoated phosphor material (europium-activated calcium aluminum silicon nitride phosphor [1, 2, 3]) and 80 ml isopropyl alcohol were sonicated while being stirred vigorously for 20 minutes. The aqueous educts solutions were prepared according to table 1. 5 ml of the Al(NO3)3·9H2O (aq) solution were added dropwise via an automatic syringe pump to the suspension. After 20 ml of Al(NO3)3·9H2O (aq) and 20 ml of NaHCO3 (aq) were simultaneosly added dropwise to the suspension and stirred for additional 30 minutes, to form Al(OH)3 on phosphor particles. The coated particles were filtered via vacuum, rinsed twice with 20 ml H2O (D.I.), twice with 20 ml isopropyl alcohol, dried at 100°C and annealed at 400°C in a tubular furnace under constant N2 flow to obtain a homogeneous coating of Al2O3 according to figure 1. After annealing at 400°C the observed colour of the coated unexcited phosphor particles changed from orange to brighter turbid orange. In order to obtain thick Al2O3 layers this procedure was repeated three times with the same coated particles.
 Figure 1: Chemical equation
Characterization
To look at the morphology of particles and to examine the efficiency of Al2O3 coating on the phosphor SEM investigations were recorded. For that reason the sample had to be coated with a thin electrically conductive layer using gold for the topography images and carbon for the chemical analysis. The SEM measurements were carried out in a Tescan Performance Nanospace (topography images of the particles) and in an Ultra 55 from Zeiss equipped with a silicon drift detector (SDD) from EDAX for energy dispersive X-ray spectroscopy. For the examination of the Al2O3 coating and the chemical analysis a cross section was prepared. Therefore the powder was embedded in epoxy resin, afterwards the sample was ground on silica carbide paper finishing with 4000 grit and was polished using a 0.25 μm diamond paste. ATR-IR spectra were recorded on a Bruker spectrometer (Alpha-P) in a range of of 4000-375 cm-1 with mid-wavelength infrared radiation. The phase compositions of uncoated and coated phosphor materials were analyzed by powder diffraction using CuKα radiation (Bruker, D8 Advance, LYNXEYE Detector, Bragg Brentano Geometry). The phase purity before treatment and after treatment was evaluated by Rietveld refinement of the XRD patterns using the program X-PertHighScorePlus (PANalytical). The photoluminescence properties of uncoated and coated phosphor material particles were determined using a spectrofluorometer (Horiba Scientific Jobin Yvon Fluorolog-3) at room temperature equipped with a 450 W xenon CW lamp. Excitation spectra and emission spectra were measured in a range of 350-600 nm and 500-800 nm with an excitation wavelength of 465 nm. The samples were made from a slurry-mixture consisting of 200 mg phosphor, 200 mg polystyrene in 1000 mg chloroform, which was stirred for 1 h. The slurry was knife-coated on a PET-foil with a wet film thickness of 25 μm. Quantum efficiencies were measured with an extra modular integrating sphere unit (Quanta-φ) using a filter in non-reflecting PTFE sample holders. The used reference material ZrO2 (Merck), possesses a similar refraction index, shows a similar particle size distribution and no emission after excitation with visible light as compared to the phosphor. Quantum effieciency and CIE color coordinates were calculated with the program FluorEssence.
Results
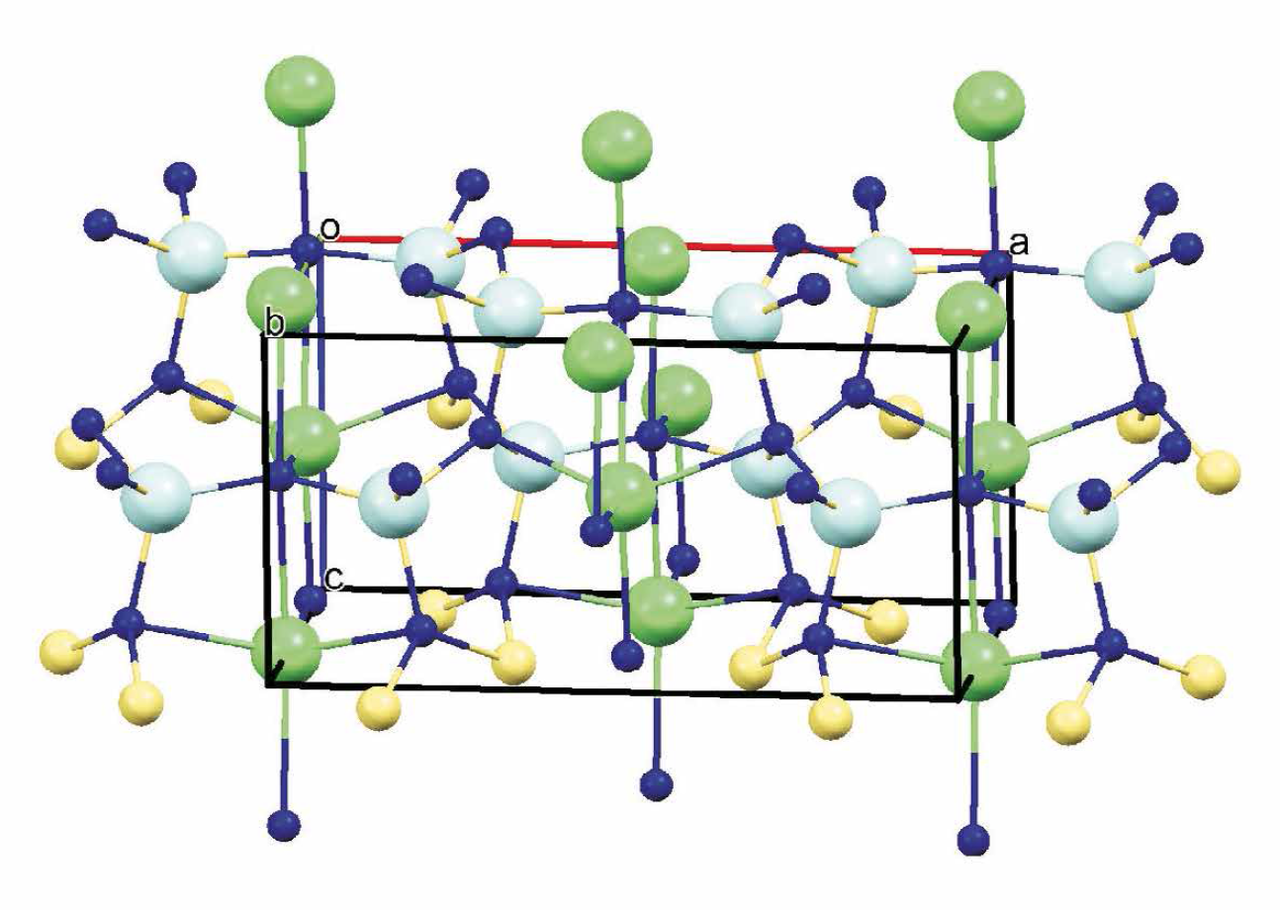
According to the material safety data sheet, the chemical content of the fine powdery orange coloured starting material, contains Ca3N2 30-40%, AlN 25-35% and Si3N4 30-40% doped with 0-5% Eu2O3. However, due to its water, acid and moisture sensitivity, it may generate ammonia gas by contact with moisture. Figure 2 shows the result of the Rietveld refinement of powder X-ray data of coated nitride phosphor before annealing. The material is pure phase europium-activated calcium aluminum silicon nitride with the chemical formula CaAlSiN3. The corresponding sharp peaks are in good agreement (ICSD 161796 CaAl0.54Si1.38N3). It has an orthorhombic crystal system with the space group Cmc21.
, N (blue), Si (yellow), Al (light blue)") Figure 2: Crystal structure of nitride phosphor Ca (green), N (blue), Si (yellow), Al (light blue)
Figure 2: Crystal structure of nitride phosphor Ca (green), N (blue), Si (yellow), Al (light blue)
The lattice parameters of the doped crystal (Figure 2) are as follows:
• a = 9.7917(1) Å
• b = 5.6461(1) Å
• c = 5.0579(1) Å and
• a unit cell volume of 279.621 Å3
The XRD pattern of coated phosphor material 1 annealed at 400°C (Figure 3, right) shows no significant peak changes compared to coated phosphor material 1 dried at 100°C in Figure 3 (left). Lattice parameters did not change in general (Table 2). Therefore it can be said that the coating process did not change the host lattice and so educts react with each other, but not with the phosphor.

Table 2: Lattice parameters of uncoated phosphor material 1 before and after annealing
The XRD pattern shows no proof for the complete formation of crystalline Al2O3 from Al(OH)3 after the annealing process (Figure 3). Only a very small peak at 38° 2θ indicates the presence of less than 0.5% crystalline Al2O3 (ICSD 75479). Therefore it can be concluded that the obtained coating layer is of amorphous nature. Also an increased background indicates amorphous parts, which was undergone a background correction.
 and of coated phosphor material 1 from (right)") Figure 3: Powder diffractograms of coated nitride phosphor 1 before annealing process (left) and of coated phosphor material 1 from (right)
Figure 3: Powder diffractograms of coated nitride phosphor 1 before annealing process (left) and of coated phosphor material 1 from (right)
Figure 4 shows the ATR-IR spectra of uncoated phosphor and coated phosphor material 1. The spectrum of europium-activated calcium aluminum silicon nitride shows several sharp peaks in the finger print area from 800 cm-1 to 400 cm-1. Since the peaks cannot be ascribed to defined absorption peaks, the uncoated phosphor spectrum should function as a reference spectrum. Figure 4 shows spectra of uncoated phosphor and coated phosphor material 1 after coating process number 1, 2 and 3 after drying at 100°C. The broad absorption peak at 3400 cm-1 can be assigned to the symmetric and asymmetric stretch modes of water and 1640 cm-1 to the stretching and bending mode of water respectively [6]. The absorption peak at 1400 cm-1 can be dedicated to the bending vibration of the ν[O—H] bond in Al(OH)3, not to residual moisture [6].
 Figure 4: ATR-IR spectra of coated phosphor material 1 annealed at 100°C
Figure 5 shows spectra of the uncoated phosphor and coated phosphor material 1 after coating process 1, 2 and 3 after annealing at 400°C. The formation of Al2O3 from Al(OH)3 can be confirmed due to the lack of signal in the area around 3400 cm-1 and new signals at around 1330 cm-1, 1200 cm-1 and 1150 cm-1 [6]. By comparing the weight of coated phosphor material 1 after drying at 100°C and 400°C a loss of weight of around 13% was observed. This loss of weight can be ascribed to the formation of H2O besides Al2O3. One trend can be observed: compared to the uncoated phosphor the intensities are decreasing due to the hydrolysis of uncoated phosphor through water and the formation of hydrolysis products during the coating process. The inorganic segment of the ν[Al—O—Al] band is observed at 800-400 cm-1 and its absorbance intensity increases with increasing amount of the Al2O3 layer [6]. Unfortunately ν[Al—N] and ν[Al—O] signals are difficult to distinguish because of the pronounced overlap of their bands. Figure 6 shows ATR-IR spectra of uncoated phosphor material, coated phosphor material 1 and 2 after the annealing process in the range of 1600-375 cm-1. Approximate trends can be observed: decreasing absorbance intensity and formation of new bands in the area between 900-375 cm-1 were observed, but larger absorbance intensity for coated phosphor material 1 in the area from 650-550 cm-1.
 Figure 5: ATR-IR spectra of coated phosphor material 1 annealed at 400°C
 Figure 6: ATR-IR spectra of uncoated phosphor material, coated phosphor material 1 and 2 after annealing at 400°C in the range of 1600-375 cm-1
The morphological analysis of uncoated phosphor is shown in Figure 7 (left) and exhibits single particles with cylindrical structure (particle size distribution of 5-15 μm). Figure 7 (right) reveals a material contrast image of the fabricated cross section of Al2O3 coated phosphor particles 1, caused by backscattered electrons. Since heavy elements (high atomic number like Ca, Eu) backscatter electrons more strongly than light elements (low atomic number like O or Al), and thus appear brighter in the image, BSE are used to detect contrast between areas with different chemical compositions. Therefore, the brighter areas in figure 7 (right) can be ascribed to the CaAlSiN3 phosphor and the darker areas to the precipitated Al2O3 and the dark background to the epoxy resin matrix. With larger magnification no homogeneous coating with Al2O3 on phosphor particles can be observed (Figure 8, left). In figure 9, phosphor particles with an inhomogeneous coating can be observed thereby showing two different modifications of Al2O3, one with agglomerates (area 2) and one with single particles (area 3). Beside that particles and agglomerates of Al2O3 are indicated. Figure 9 (right) shows an almost intact Al2O3 coating of a single particle with an irregular layer thickness up to 4 μm. The formation of different Al2O3 modifications was caused by the reaction conditions. The synthesis of Al2O3 coating on the phosphor was done in excess of educts Al(NO3)3·9H2O and NaHCO3. Agglomerates are formed when attractive forces overwhelm repulsive forces. The formation of agglomerates can be prevented by changing the reaction conditions of the synthesis like concentration of educts more specifically ion concentration and temperature.
 and a material contrast image of coated phosphor material 1, 200xBSE (right)") Figure 7: SEM image of uncoated phosphor material 1 at a magnification of 2.26kx (left) and a material contrast image of coated phosphor material 1, 200xBSE (right)
Figure 7: SEM image of uncoated phosphor material 1 at a magnification of 2.26kx (left) and a material contrast image of coated phosphor material 1, 200xBSE (right)
 and a single grain of coated phosphor material 1 at a magnification of 4000x BSE (right)") Figure 8: Material contrast image of coated phoshor material 1 particles 1000x BSE, 15 kV (left) and a single grain of coated phosphor material 1 at a magnification of 4000x BSE (right)
Figure 8: Material contrast image of coated phoshor material 1 particles 1000x BSE, 15 kV (left) and a single grain of coated phosphor material 1 at a magnification of 4000x BSE (right)
Figure 9 (left upper corner) shows a material contrast image of coated phosphor material 2. The elements determined by EDX are dyed in different colours and labeled in the upper right corner of the pictures. Ca (turquoise), Al (yellow), Si (magenta) and N (green) are found in the brighter areas. Al (yellow) and O (blue) are also found in the darker areas around the brighter areas (phosphor), according to the formation of an Al2O3 layer. In contrast to phosphor material 1 no completely intact layer of Al2O3 was observed on coated phosphor material 2. Figure 10 shows the obtained EDX spectrum of the coated phosphor material 1, particular elements of the phosphors host lattice show significant peaks of Ca, Al, Si and N. Peaks of O and C can be assigned to the epoxy resin matrix.
 Figure 9: Coated phosphor material 2 at a magnificastion of 1000x BSE
Noticeable changes are observed in peak intensities of the elements like shown in figure 9 of area 1, area 2 and area 3. The results of the BSE image determined area 1 as the host lattice of the phosphor, therefore peaks for Ca, Al, Si and N are found, but also a high peak of C and a peak for O which stem from the epoxy resin. Area 2 shows a significant peak for Al and a larger peak for O than in area 1 due to the formation of Al2O3 after the coating and annealing process. Based on the obtained peaks in area 3 both epoxy resin and Al2O3 are coexistent. Area 2 and area 3 have similar spectra. They only differ in agglomeration of Al2O3. Area 3 contains more epoxy resin less Al2O3, area 2 more Al2O3.
 Figure 10: EDX spectra of coated phosphor material 1, area 1, area 2 and area 3
Figure 11 shows the excitation and emission spectra of uncoated phosphor material at. The excitation spectrum shows a broad peak from the NUV to the VIS area with a peak maximum at 352 nm. The excitation of the host lattice and further energy transfer to the dopant Eu2+ can be ascribed to the peak maximum in the NUV region. The excitation peak corresponding to Eu2+ extends towards the visible region with a maximum at 430 nm. On this account the phosphor can be excited by conventional LED chips and is therefore suitable for use in chip-on-board technology. The CaAlSiN3:Eu2+ phosphor shows a broad symmetric single band in a range of 500-800 nm with an emission maximum at 643 nm which is typical for a 5d-4f transition of Eu2+ [3]. It covers a part of the visible light in the area between 550 nm and 750 nm (blue LED-Chip) and it is therefore a well suited phosphor for use in chip-on-board technology. The visible emission colour of uncoated phosphor is deep red. After the coating process the emission colour of unexcited particles changes from orange to brighter turbid orange, which can be ascribed to a not absolutely optically transparent precipitated layer of Al2O3. Emission spectra of uncoated phosphor material and coated phosphor material 1 are compared in figure 11. The shape and the width of the emission band did not change after the coating process. A hypsochromical shift occurred with increasing number of Al2O3 coating steps (Figure 11, Table 3). This could also be caused by the used sample preparation method. Although the samples were made in the same way, the comparability can not be assured because the layer thickness could vary and hence a diverse concentration in the film can occur. Affirmative an oxidation of Eu2+ to Eu3+ was not observed. The minimal shift of 3 nm of the emission maximum caused a negligible shift of CIE colour coordinates (Figures 11&12, Table 3). Furthermore a reduction of the quantum efficiency of coated phosphor material 1 compared to untreated phosphor occurred.
 Figure 11: Excitation and emission spectra of uncoated and coated phosphor material 1&2 with an emission maximum of 638 nm and 643 nm
The quantum efficiency (QY) compared to uncoated phosphor decreased for 13% of coated phosphor material 1 and for coated phosphor material 2 for 16%. The reduction of the quantum efficiency of coated phosphor material 1 could be caused by the thick layer of Al2O3 on the particles.
Moreover the images taken with SEM indicate the fact that phosphor particles were embedded in a matrix of Al2O3 and besides that the XRD analysis determined that the obtained coating is of amorphous nature (Figure 3). Therefore diffuse scattering of light at the Al2O3 layer may result in reduced excitation of Eu2+ and diminished quantum efficiencies.
 Figure 12: CIE Diagramm of uncoated and coated phosphor materials 1&2
Conclusion
 Table 3: Luminescence properties of uncoated phosphor and coated phosphor material 1&2
In summary, we have demonstrated a route to coat CaAlSiN3 phosphor. In regard to the use of coated phosphor particles in chip-on-board technology, the coating procedure itself does not influence the emission spectra seriously, no mentionable colour shift occurred (Figures 12&13). Moreover a colour shift due to an oxidation of Eu2+ to Eu3+ could not be observed. The ATR-IR analysis confirmed the transformation of Al(OH)3 to Al2O3 after annealing it at a temperature of 400°C. The XRD analysis showed the amorphous nature of the formed Al2O3 coating.
Acknowledgements:
Thanks to Tridonic Jennersdorf GmbH who enabled me to work on that forward-looking topic in the course of my Master Thesis at Graz University of Technology. Thanks to Sergey Borisov from the Institute of Analytical Chemistry and Food Chemistry at Graz University of Technology. This work was supported by a grant from the Austrian Forschungsförderungsgesellschaft FFG, Projekt Nr. 842562.
References:
[1] Piao X., Machida K., Horikawa T., Hanzawa H., Shimomura Y., Kijiama, N.; Chem. Mater. 2007, 19, 4592-4599
[2] Kim H.S., Horikawa T., Hanzawa H., Machida K. J.; Phys.: Conf. Ser. 2012 379 012016
[3] Uheda K., Hirosaki N., Yamamoto Y., Naito A., Nakajima T., Xamamoto H.; Electrochem. Solid St. 2006 9 (4) H22-H25
[4] Sun J., Sun R., Du H; Appl. Surf. Sci. 2012 258 4569-4573
[5] Zhuang J., Xia Z., Liu H., Zhang Z., Lia L.; Appl. Surf. Sci. 2011 257 4350-4353
[6] Ghezelbash Z., Ashouri D., Mousavian S., Ghandi A.H., Rahnama Y.; Bull. Mater. Sci 2012 Vol. 35 No. 6 925-931
