Issue 63 | Challenges in UV Measurement
Over the past decade UV LEDs have emerged as a highly attractive alternative to conventional UV emission sources. They are cost effective and energy efficient devices in a small housing. These advantages allow new fields of applications and access to a larger group of users - even in the consumer market, e.g. water purification. Dr. Tobias Roesener, Product Manager at Instrument Systems, explains what makes accurate measurement of UV LEDs so complicated and what the crucial requirements on the measurement equipment are. In addition, he discusses calibration and stray light issues.
The development of UV LEDs and their production are technologically very challenging. UV ranges from 100-400 nm and is split into UV-A, UV-B and UV-C according to ISO-21348:
- UV-A = 315-400 nm,
- UV-B = 280-315 nm,
- UV C = 100-280 nm
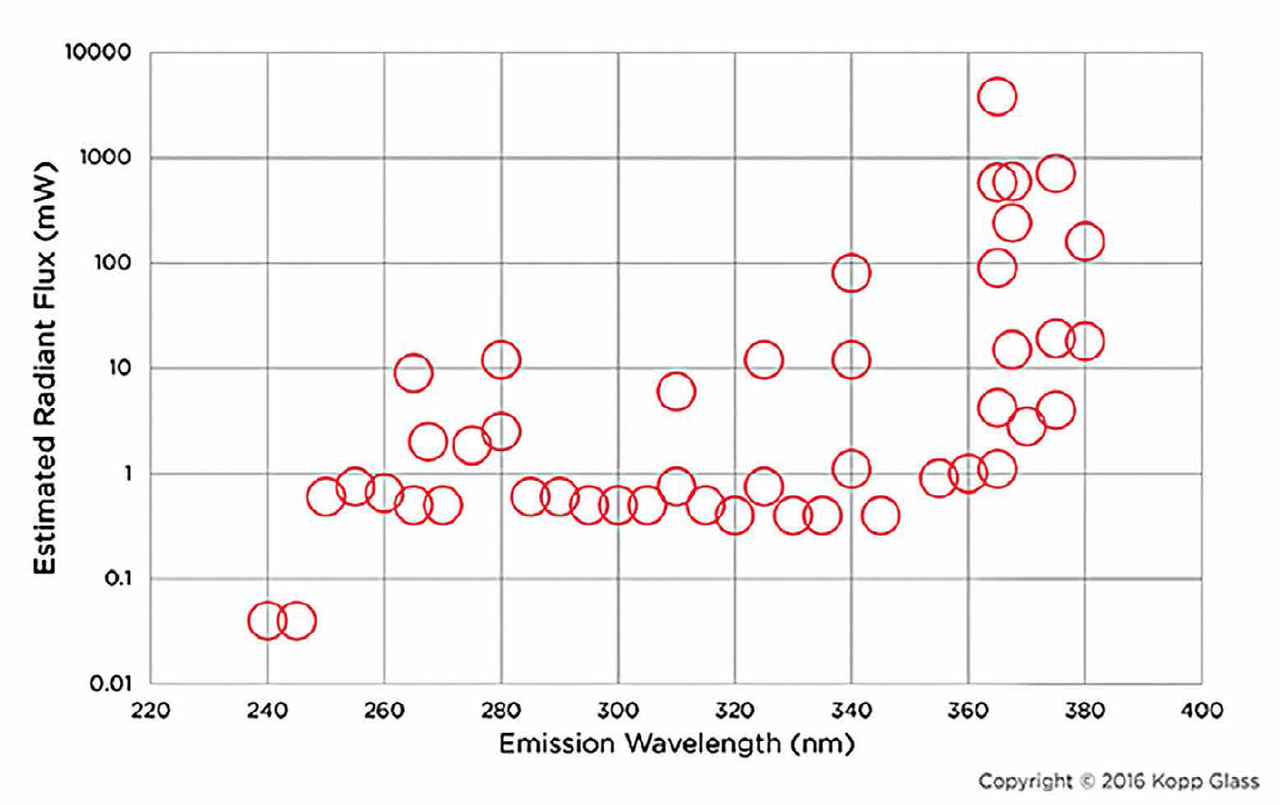
However, vacuum UV from 100-200 nm is strongly absorbed by atmospheric oxygen. Particularly the UV-B and UV-C spectral ranges are very demanding. This challenge becomes apparent with the decreasing optical output power with decreasing emission wavelength (Figure 1). Therefore, the requirements for the corresponding optical measurement equipment with respect to sensitivity and accuracy are very high. Furthermore, challenges in metrology of UV radiation increases with deceasing wavelength.
The article at hand presents main challenges in the measurement of UV radiation in the context of UV LEDs. The focus is on the comparison of integrating spheres (ISP) with barium sulfate (BaSO4) reflective coating (typically used for VIS and IR applications) and polytetrafluoroethylene (PTFE) reflective material for the measurement of radiant power in the spectral range between 200 and 400 nm.
Throughput
Low optical output power in the sub milliwatts regime for UV-B and UV-C spectral range requires very sensitive measurement equipment. Apart from a very sensitive spectroradiometer, an ISP with high throughput facilitates these measurements. Typically, the diffuse reflectivity of the inner surface of an ISP is chosen to be between 94% and 96%. This is a trade-off between very high throughput and measurement accuracy, on the one hand and low susceptibility to aging due to reflectivity changes on the other hand. High reflectivity allows very high throughput but even small changes result in a high change in throughput - and the other way round.
Figure 2 shows the typical reflectivity of BaSO4 and PTFE between 200 and 400 nm. BaSO4 has sufficient reflectivity down to approximately 300 nm. Below 300 nm its reflectivity starts dropping significantly and below 250 nm the reflectivity is insufficient for sensitive optical measurements. PTFE, on the other hand, shows reflectivity well above 94% for the entire UV spectral range.
The relative throughput of two ISPs made with BaSO4 and PTFE is depicted in figure 3. The curve characteristic corresponds to the above-mentioned reflectivity properties. The throughput of the PTFE ISP is approximately 3 times larger than that of the BaSO4 ISP for UV-A and -B. For UV-C the BaSO4 reflectivity drops and the relative throughput increases drastically up to a factor of over 10 in favor of PTFE.
These results show that BaSO4 - from a perspective of throughput - is only sufficient for UV-A, and possibly for UV-B. PTFE, on the other hand, is suitable for the characterization of UV LEDs down to 200 nm.
Fluorescence
Organic molecules from dust, exhaust gases, oil, residuals from production processes, etc. typically cause undesirable fluorescence in BaSO4 and PTFE ISPs. Short wavelength radiation is absorbed and (partially) converted to fluorescence radiation at higher wavelengths.
 Figure 2: Typical reflectivity of BaSO4 and PTFE materials in the UV spectral range
") Figure 3: Throughput of an ISP with PTFE reflective material relative to one with BaSO4 reflective coating (both with 150 mm inner diameter)
Figure 3: Throughput of an ISP with PTFE reflective material relative to one with BaSO4 reflective coating (both with 150 mm inner diameter)
 Figure 4: Normalized spectra of discrete laser excitation at different wavelengths in a BaSO4 ISP
 Figure 5: Fluorescence matrix of a BaSO4 ISP with 150 mm inner diameter
- Fluorescence is therefore critical in two ways:
During calibration the actual spectrum of a calibration lamp - typically deuterium - is “modified” by fluorescence. Radiation at a lower wavelength is absorbed causing a lower signal. Part of the absorbed energy is transferred to a higher wavelength causing an additional signal. The spectral distribution is therefore corrupted by fluorescence and will affect measurement accuracy already on the calibration level - During the measurement, parts of the UV-LEDs spectrum will be absorbed and an additional fluorescence signal will occur at higher wavelengths (Figure 9). This effects measurement accuracy on the measurement level, e.g. for radiant power and centroid wavelength
Figure 4 shows typical fluorescence spectra measured in a BaSO4 ISP. Excitation is provided by a tunable laser. The excitation at 240, 250 and 260 nm results in a broad fluorescence peak around 400 nm with up to 1%rel of the excitation signal level. Fluorescence larger than 0.1% is considered to be undesirable. For excitation above 280 nm there is no detectable fluorescence visible.
A more complete overview of fluorescence spectra than figure 4 is given in figure 5 in a “fluorescence matrix”. This color plot shows the normalized signal of fluorescence spectra excited by a tunable laser. The fluorescence of the BaSO₄ ISP around 400 nm for excitation wavelengths below 280 nm is clearly visible. Excitation below 240 nm does not deliver useful results due to low BaSO4 reflectivity (Figure 2).
PTFE also typically shows fluorescence [2], which has different characteristics to BaSO4. Figure 6 shows the fluorescence matrix of a PTFE ISP “as-is”, i.e. characterized after delivery from the supplier of the PTFE material. The characteristic fluorescence spectra of around 300 nm results from excitation wavelengths below 300 nm.
 Figure 6: Fluorescence matrix of a PTFE ISP “as-is” with 50 mm inner diameter
 Figure 7: Fluorescence spectra of a PTFE ISP with 50 mm inner diameter at 220 nm excitation wavelength. A proprietary preconditioning by Instrument Systems efficiently suppresses the fluorescence
 Figure 8: Fluorescence matrix of the same PTFE ISP as in figure 6 after preconditioning. Fluorescence is efficiently suppressed to a level well below 0.1% for the entire UV spectral range
 Figure 9: Both measurements were acquired with calibrated equipment. The additional “blue” signal which is visible in both spectra is caused by the housing of the LED
In order to efficiently suppress the harmful fluorescence, Instrument Systems developed a proprietary “preconditioning” of its PTFE ISPs. It is applied prior to calibration for high accuracy calibration and measurement. Figure 7 shows the effect of the preconditioning on the fluorescence initially excited by laser radiation at 220 nm. The fluorescence is suppressed to a signal level well-below 0.1%. The preconditioning is effective for the entire UV spectral range that is apparent from the fluorescence matrix shown in figure 8.
The effect of fluorescence on the spectrum of a 285 nm UV-LED shown in figure 9, which is measured, with an “as-is” PTFE ISP. On the long wavelength slope of the peak there is an additional shoulder caused by fluorescence. This fluorescence occurs between 300 and 400 nm, which corresponds very well with the fluorescence matrix in figure 6.
When the same UV-LED is measured with a preconditioned PTFE ISP the shoulder originating from fluorescence vanishes. The additional offset between both spectra may be due to the absence of fluorescence as well: because no radiation is absorbed at the peak wavelength the absolute signal level is higher and a normalization of both spectra to 100% results in an offset. In summary, this is a clear example of how fluorescence affects an LED spectrum.
Stability
A key requirement for optical measurement is the stability of the measurement equipment in order to guarantee long-term comparability of measurement results. For measurements, the question is how stable are the optical components to UV exposure. For instance, transmission of optical fibers - depending on the exact material - may degrade due to solarization when exposed to UV.
An investigation of the optical stability of BaSO4 and PTFE ISPs was undertaken in order to find out about their stability to UV exposure. For this purpose the optical output of a deuterium lamp was recorded over time. Figures 10 and 11 show the integrated detector signal (normalized to the detector signal at t = 0) of a BaSO4 and preconditioned PTFE ISP over 48 and 160 hours, respectively. In both cases the integration was performed for four 50 nm intervals between 200 and 400 nm. A solarization of the optical fiber was ruled out in the course of the measurement with a reference setup that was not exposed to the UV radiation.
The BaSO4 ISP showed a significant degradation in throughput of up to 50% in 48 hours for the entire UV spectral range (Figure 10). It is apparent from the graph that even after 24 hours, degradation is still visible and saturation may not be expected even after 48 hours.
In contrast to that the preconditioned PTFE ISP shows only very little drop in the integrated signal over 160 hours - equally for the entire UV spectral range. This minor drop over such a long time, however, can be attributed to the degradation of the deuterium lamp - which is known not to be stable over such a long duration - rather than a degradation of the PTFE ISP throughput. In summary, a preconditioned PTFE ISP is the measurement probe of choice when stability to UV exposure is vital.
 Figure 10: Normalized integrated signal of a BaSO4 ISP under exposure of a 30 W deuterium lamp over 48 hours. The detector signal is integrated in 50 nm intervals between 200 and 400 nm
 Figure 11: Normalized integrated signal of a preconditioned PTFE ISP under exposure of a 30 W deuterium lamp over 160 hours. The detector signal is integrated in 50 nm intervals between 200 and 400 nm
Measurement Accuracy
Measurement accuracy is paramount for the reliability and comparability of optical measurements. Every measurement has a uncertainty that originates from emission stability of the calibration source, environment, calibration methodology, instrumentation, etc. These uncertainties contribute to an uncertainty budget that has to be evaluated for each individual measurement setup. It is expressed as the combined variance u 2 c for a certain measure and y = f(x1, x2, … xN ), e.g. radiant power and corresponds to the sum of variances of y resulting from variations of each input xi [3]:

The so-called “expanded” measurement uncertainty corresponds to a 95% confidence that a measured result is within the given confidence interval (for normal distributed quantities the expanded uncertainty is twice (k = 2) the standard uncertainty). This expanded measurement uncertainty particularly includes the uncertainties given by national laboratories (e.g. NIST, PTB) for their calibration of standards which are the reference standard for calibration at spectroradiometer manufacturers.
In the VIS spectral range calibration standards are available with quite low uncertainties from national laboratories. In contrast to that, for the UV spectral ranges no calibration standards are available for radiant power below 300 nm.
A workaround for LED measurements are calibration standards for spectral irradiance. These can be used to perform calibrations of spectral partial radiant power by a conversion from spectral irradiance. However, the uncertainties for UV spectral irradiance standards are comparatively large in contrast to the VIS spectral range. Figure 12 shows an example of the relative measurement uncertainty (in terms of combined variances u 2 c ) for Instrument Systems calibration to spectral irradiance / spectral partial radiant power. Compared to the measurement uncertainty in the VIS above 400 nm the measurement uncertainty in the UV is 2 - 4 times larger. However, the uncertainty in the UV is dominated by the contribution of the calibration standards (red). For wavelengths below 250 nm the instrumentation of Instrument Systems (blue) contributes significantly to the measurement uncertainty.
Instrument Systems is currently working on advanced calibration procedures and an improvement of instrumentation to further reduce measurement uncertainties in the UV-C spectral range. Particularly, a high throughput and low fluorescence ISP may contribute to these improvements as well as a stray light correction of the spectroradiometer (Figure 13).
Stray Light Correction
Each pixel of an array detector is assigned to a specific spectral range. Light from another spectral range falling on that same pixel is considered stray light which compromises the measurement result because it adds additional signal to this pixel. Stray light is an intrinsic property of the spectrograph and is caused by grating defects, higher diffraction orders, reflection and scattering on surfaces, and many more. Stray light suppression in the UV spectral range is very demanding and poses a challenge even to very advanced spectrographs with high stray light suppressing design, e.g. Instrument Systems’ CAS-series.
A state-of-the-art numerical stray light correction (SLC) was suggested by Yuqin Zong (NIST) [4]. This methodology was implemented at Instrument Systems for improved stray light suppression of CAS series spectroradiometer and higher accuracy measurements in the UV spectral range [5]. Figure 13 depicts the effect of the SLC. It shows the spectrum of a UV-C LED at 260 nm with and without SLC. Stray light is suppressed many orders of magnitude to a level comparable with a scanning double monochromator.
 and UV spectral range. For UV the measurement uncertainty is split by its variance contributions u2i from calibration standards and instrumentation according to formula (1)") Figure 12: Measurement uncertainty in terms of combined variance u2c for irradiance in the VIS (orange) and UV spectral range. For UV the measurement uncertainty is split by its variance contributions u2i from calibration standards and instrumentation according to formula (1)
Figure 12: Measurement uncertainty in terms of combined variance u2c for irradiance in the VIS (orange) and UV spectral range. For UV the measurement uncertainty is split by its variance contributions u2i from calibration standards and instrumentation according to formula (1)
 on the measured spectrum of a UV-C LED [5]") Figure 13: Effect of a state-of-the-art numerical stray light correction (SLC) on the measured spectrum of a UV-C LED [5]
Figure 13: Effect of a state-of-the-art numerical stray light correction (SLC) on the measured spectrum of a UV-C LED [5]
Summary
An overview on the main challenges of radiant power measurement of LEDs with ISPs in the UV spectral range was given.
The following two tables summarize the assessment of BaSO4 and preconditioned PTFE ISPs with respect to throughput, fluorescence and stability to UV exposure which are three key performance indicators highly relevant for UV measurement.
In summary, PTFE ISPs are particularly suitable for radiant power measurements in the UV spectral range. Particularly, a proprietary preconditioning of PTFE by Instrument Systems ensures efficient fluorescence suppression and enables sensitive, accurate and reliable UV measurements.
Measurement accuracy for radiant power in the UV spectral range down to 200 nm is currently limited by the non-availability of UV calibration standards from national laboratories. Spectral Irradiance calibration standards, which may be used for conversion to spectral partial radiant power currently, lack low measurement uncertainties comparable to VIS calibration standards. This equally affects all spectroradiometer manufacturers. However, Instrument Systems provides highly precise measurement solutions for UV with a high degree of comparability. Additional benefit for accurate UV measurement is provided by a state-of-the-art numerical stray light correction that reduces stray light by a few orders of magnitude for UV LEDs.
 Table 1: Summary assessment of key performance indicators for BaSO4 ISPs
 PTFE ISPs") Table 2: Summary assessment of key performance indicators for (preconditioned) PTFE ISPs
Table 2: Summary assessment of key performance indicators for (preconditioned) PTFE ISPs
References
[1] J. Galbraith, Current State of UV LED Technology, Kopp Glass, 21 March 2016: http://www.koppglass.com/blog/ current-state-of-uv-led-technology/
[2] P.-S. Shaw, Z. Li, U. Arp und K. R. Lykke, Ultraviolet Characterization of Integrating Spheres, Applied Optics, Bd. 46, Nr. 22, pp. 5119-5129, 1 August 2007
[3] JCGM 100: Evaluation of Measurement Data - Guide to the Expression of Uncertainty in Measurement, 2008
[4] Y. Zong, Simple spectral stray light correction method for array spectroradiometers, Applied Optics, Bd. 45, pp. 1111-1119, 2006
[5] D. Konjhodzic, Stray Light Correction for Array Spectroradiometers (Application Note), 2016: http://www. instrumentsystems.com//fileadmin/editors/downloads/White_ Papers/Application_note_-_Stray_light_correction_en.pdf
(c) Luger Research e.U. - 2017
