LED Source Modeling Method Evaluations
Producing accurate simulations of LED based optical systems requires accurate source models. This means the source models must not only produce the correct distribution of light in a far field measurement, they must also produce the correct near field behavior since secondary LED optics are often employed in very close proximity to the LED. Accurate simulations are vital to the design process especially with lens optics commonly used on LEDs given the high cost and long lead times for lens tooling. The data presented in this paper is a direct result of the lessons learned by one manufacturer about the importance of simulation accuracy.


Overview
3 main source modeling methods1 can be used, having a very different approach:
Type 1 - Luminance data that is based on calibrated digital images taken from viewpoints all around the source. There is no geometry included with this type of source model. The image data is used to create 3D rays representing the initial emanation of light from the source. Figure 1 shows one of many images taken of an LED. The image was viewed in Radiant Imaging’s ProSourceTM software.
Type 2 - Goniometric intensity distribution with source geometry and surface luminance data. This type of model distributes ray emanation points across the luminous surfaces of the source geometry considering the relative luminance values of the various source surfaces. The ray directions are determined by the intensity distribution assigned to the source, which is generally a measured far field distribution.
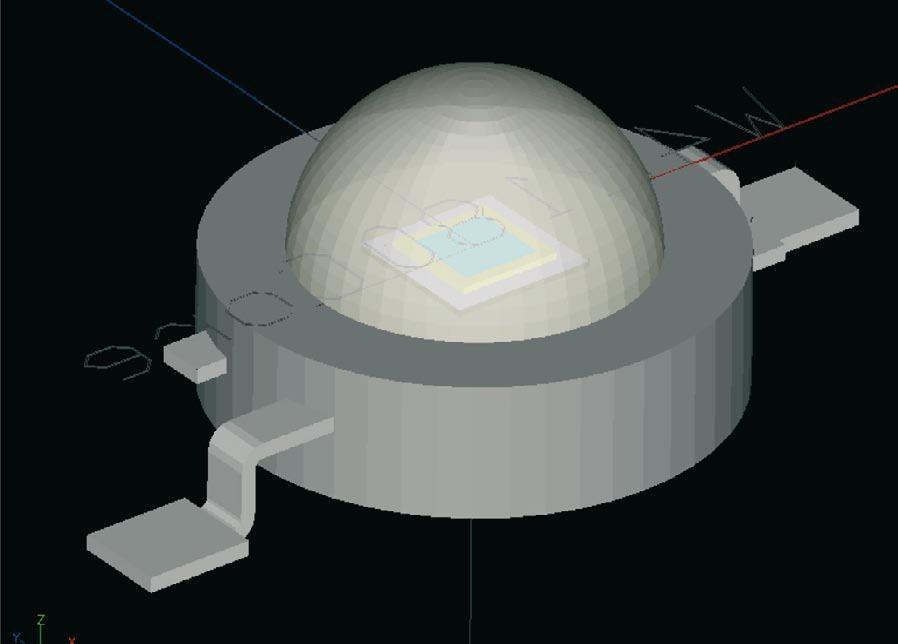
Type 3 - Self-generated intensity distribution resulting from detailed source geometry and luminance data. An example of the source model geometry for the Seoul Semiconductor P4 LED in Photopia’s source library is shown in Figure 2. This type of model uses the luminance data for the LED chip itself to generate initial rays, which then interact with the surrounding primary optical components such as reflectors and lenses. This type of model creates the most accurate representation of the source behavior, that is to say the most accurate 3D ray emanation points and directions, since it replicates the actual light paths from the chip out of the primary optics.
As previous work1 documents, Type 1 & 2 source models have a limited range of applications in which they can be used before loss of accuracy is experienced. The purpose of this article is to present 3 case studies that compare the use of these 2 source model types to show their relative performance. This is very important in cases where a designer has both types of source models available for a given LED and needs to know which type will produce more accurate results for their project. Furthermore, it is important to understand the expected level of accuracy when only a Type 1 source model is available.
Type 1 models are commonly used for LEDs since many LED manufactures distribute 3D ray sets built from the digital images and as a result, many optical software products do not see a need to create separate Type 3 models. While several companies offer services to measure the digital images, the results in this paper are based on image data measured by Radiant Imaging. Type 3 models are commonly used only when they are provided in the source library distributed with the optical software.
To illustrate the differences in the way rays are generated between a Type 3 and 1 model, Figures 3 and 4 show the CREE XR-E LED model which is included in the Photopia software library. The left side of each image shows the light field inside the LED while the right side shows the source geometry. In the Type 1 model, the geometry is only for reference as it is not part of the model. The location of the LED chip is near the top of these images, just above the bright region of light in the Type 3 model image.
Artifacts in the light field as a consequence of the specific methods used to create the 3D ray emanation points in the Type 1 model are clearly seen in Figure 4. The light field is generated in a region well in front of the actual chip location. To understand why such artifacts are present, one must understand how the 3D rays are generated from a set of digital images. The digital images are collected from many viewing angles around the source. These 2 dimensional images all center around some reference point on the source. For this LED, that reference point is in the center of the metal ring, near the base of the glass dome. From this set of 2D image data, 3D emanation points are determined. As seen in Figure 1, precise data is available in the plane of each image so the local X & Y values for a ray point can be determined, but no data is explicitly known about the 3rd dimension, essentially the Z value of the ray out of the plane of the image. The software that creates the 3D ray sets provides various geometric surface options to which the 3rd dimension can be mapped. Figure 4 uses the “undefined” option since it is often used in the ray sets distributed by the LED manufactures, which makes it a good reference for these case studies.
Case Studies
These case studies use data collected by BetaLEDTM during the development of their NanoOpticTM LED outdoor area lighting lens optics. The data includes measured luminous intensity distributions along with simulations using both Type 1 and Type 3 source models in Photopia. The optics were measured at Independent Testing Laboratories, Inc. (ITL) in Boulder, Colorado, USA. The simulations used lens geometry that was scanned from the physical as-built parts. This is important since the as-built parts did not always perfectly match the intended design, which removes a potential source of difference between measured and simulated performance.
Case 1 – Roadway Type 5 Distribution Lens (Wide round pattern optic with a gel filled gap between LED and lens)
Figure 5 shows very significant beam deviations between the measured (blue) and simulated (red) data for the Type 1 model, especially in the higher angle range. This is a critical part of the beam on this type of optic since the goal is to direct as much light as possible just below the cutoff angle of 80 deg. If the simulations are under predicting these values, then the optimization of the optic will be misdirected. The Type 3 model plots in Figure 6 show closer correlation to the measured data, especially in the higher angles. The lower angles do deviate from the measured data, but generally follow the same trends in the beam pattern.
Case 2 – Roadway Type 5 Distribution Lens (Wide round pattern optic without gel)
The differences between the Type 1 and Type 3 model performance are not as great as in the first optic, but the Type 1 model in Figure 7 does show an upward shift in the beam angle and significantly more light directly below the luminaire. Accurately predicting the peak vertical angle in the intensity distribution is another critical issue in this type of lens. Figure 8 shows more accurate overall beam shapes as well as peak beam angles.
Case 3 – Medium Beam Lens (With a gel filled gap between the LED and lens)
This case illustrates how the differences between the 2 model types remains significant when a gel is used between the LED and lens even in a much narrower beam distribution. The higher intensities seen in the central part of the beam using the Type 1 model in Figure 9 result from the extra lumens that were not directed to the higher angles in the distribution where they belonged. The Type 3 model results shown in Figure 10 show a much closer beam shape at the full range of angles in this distribution.
See Figure 5 (see LpR magazine)
See Figure 6 (see LpR magazine)
See Figure 7 (see LpR magazine)
See Figure 8 (see LpR magazine)
See Figure 9 (see LpR magazine)
See Figure 10 (see LpR magazine)
Summary
The 3 cases presented illustrate that there are significant differences in simulated results depending on the source modeling method used. These results show that a Type 3 model more closely matches the measured performance than the Type 1 model for both wide and medium beam lenses. The differences are greatest when an index matching gel is used between the LED and lens. The main reasons for this are that in addition to the challenge Type 1 models have in creating accurate 3D ray emanation points, all of their digital images showing the luminous view of the source are measured in air. When a gel is used between the LED and the lens, light never exits from the LED primary lens into air so the measurements are inappropriate. Since Type 3 models include the lens geometry, the material can simply be changed to account for the glass / gel interface instead of glass / air.
The 2nd set of data shows that the Type 1 model fairs better when there is no gel, yet it does not outperform the Type 3 model. Wider beam optics are more sensitive than narrower beam optics to exactly how much light is directed onto each part of the lens. As the beam gets narrower, more light is directed to the same angles in the beam and differences in the amount of light sent to each part of the lens between the simulation and physical reality become less important. It should also be noted that other 3D ray emanation point geometry mapping options were tested such as mapping the points to a sphere and the results did not vary significantly from those presented here.
Given a choice between Type 1 and Type 3 source models for the same LED, a Type 3 model will likely produce more accurate results, especially as the beam gets wider. If gels are used between the LED and lens, then Type 1 models should not be used since the measurements on which they are based is not appropriate for this situation.
