Measurement of Angular and Spatial Resolved Spectral Rayfiles
The enhanced complexity of modern lighting systems has increased the importance of realistic light source models during the optical design process of LED-based luminaires. I. Rotscholl, Research Associate, K. Trampert, C. Neumann, I. Leopoldo Sayanca from the Karlsruhe Institute of Technology, U. Krüger and F. Schmidt from the TechnoTeam Bildverarbeitung GmbH, propose a method to enhance the often used LED light source model “rayfile” towards a “spectral rayfile”. A spectral rayfile would be a model that associates each ray with its own spectrum and therefore describes varying spectra as a function of angular direction and spatial starting position. The PMBS (physical motivated basis spectra) method is based on the assumption that each LED spectrum consists of a weighted sum of individual basis spectra, for instance those of individual semiconductors and phosphors. There is no need for any special measurement equipment but a classic nearfield goniophotometer and some off-the-shelf optical filters. This method requires at least one spectral measurement and just a minimum of goniophotometric measurements with different optical filters. Finally, the authors demonstrate the potential of this method by applying the concept on a typical LED and compare the results to the often used Blue/Yellow approach in terms of accuracy and applicability.
Due to the evolution of the new light source technologies LED and OLED, lighting technology has become more than the efficient creation of light. The new light source technologies are more efficient than the conventional sources and they also offer the possibility to tune colors and spectra. Therefore light colors and spectra and their physiological as well as psychological effects on humans in daily situations, for instance their influence on the learning process of school children [1], are currently an important aspect of interdisciplinary research called human centric lighting. However, there are problems if those actinic spectra are not only generated but shall be generated efficiently in complex optical systems.
Optical system design bases mainly on reflection, refraction and scattering and sometimes diffraction. However, all effects are not only functions of angles of incidence but also include wavelength dependencies. This may lead to color fringes or other undesired spectral artefacts. Unexpected artefacts may also occur if there are spectral variations of the light source, as for instance, phosphor based white LEDs, whose spectra often change strongly as a function of emission angle due to different phosphor conversion lengths. There may also be spectral variations as a function of spatial dimension, which might result from different LED positions or different environmental conditions such as the temperature distribution on the board. Therefore an efficient detection and prevention of spectral artefacts during the optical design process in modern ray tracing software is only possible if accurate spectral, angular and spatial resolved information is available within the light source model.
In this article, we will focus on the direct measurement of spectral light source models of LEDs. After a brief summary of current methods, we will introduce a fast and accurate measurement method to create such models and test the method with one example.
State of the Art
The rayfile is one of the most important light source models in ray tracing software [2]. It lists up several million or even more individual rays. Each ray is described by the starting position x, y, z, the direction a, b, c and a partial luminous or radiometric flux φ. Rayfiles are the results of the measurement of the light source in the nearfield.
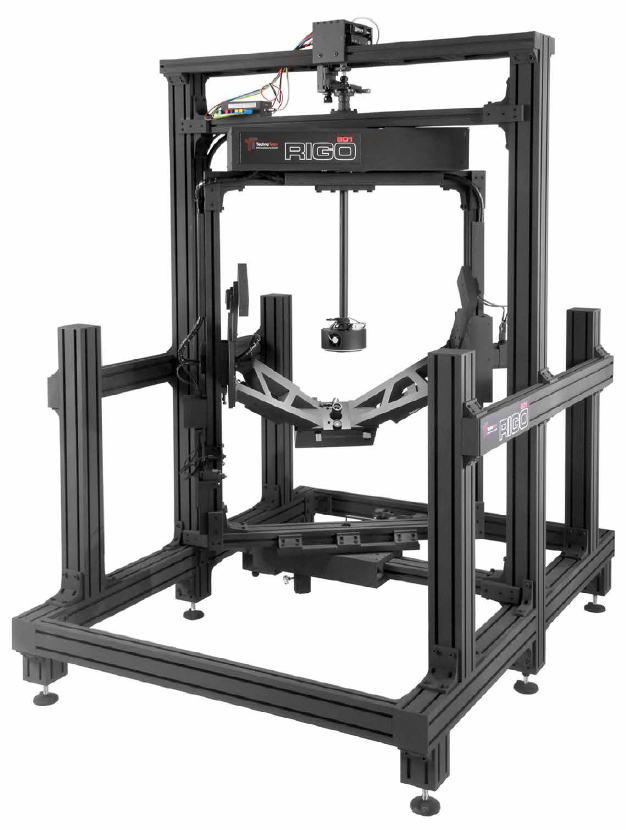
The measurement is done with a nearfield goniophotometer [3] as visualized in figure 1. The different types of goniophotometers have in common, that there are at least two moving axes, which move either the device under test or an ILMD (Imaging Luminance Measurement Device) in angular space. The spatially resolved ILMD integrates the photons and reduces the n-dimensional spectrum to a one dimensional value for each pixel. The product of the lens’ and optical filter’s transmission function and the ILMD’s responsivity function typically equals the V(λ) function describing the photometric sensitivity of the human eye. Due to the spectral integration of the ILMD there is no spectral resolved information available in such classic rayfiles.
If the ILMD would be replaced by a hyperspectral camera, the spectral information would remain available. However, the measurement time may be long due to the large number of spectral resolved measurements and a longer integration time, which may even lead to a start-stop operation [4, 5]. Also the system produces an extremely large amount of data - a spectrum for each pixel at each angular position - and the uncertainties of the reconstructed spectra are currently hard to predict [5].
Creation of spectral rayfiles with conventional goniophotometric measurements
As shown in table 1, Rykowsky summed up four different possibilities to combine spectral measurements and conventional goniophotometric measurements [4]. They differ in the amount and type of measurements and so in measurement time. While the options on the left hand side require only one spectral measurement, the options on the right hand side require time-consuming angular resolved spectral measurements. The row differs in the amount of goniophotometric measurements.
 Table 1: Concepts to add spectral information to rayfiles and allocated state of the art methods
The upper left option of table 1 is not able to account any varying spectra and will therefore not be discussed further. The bottom right methods require angular resolved spectral measurements and different filter measurements. In [6] a larger number of ILMD measurements are combined with angular resolved spectral measurements. Rykowsky [4] describes a spectral adjusting of the angular resolved spectra to reconstruct measured chromaticity coordinates. However, both measurement time and the generated amount of data are higher compared to other methods.
Based on the upper right option, Jacobs et al. proposed a method, which is capable of producing angular resolved spectral rayfiles by performing a principal component analysis of the angular resolved spectra [5]. This method reduces the amount of memory used for the data. However, it can only be used if there are no significant spectral variations as a function of spatial dimension [4].
The remaining methods rely on one spectral measurement and more ILMD based measurements. An additional ILMD based measurement as used for the bottom left methods is typically much faster than an angular equally resolved spectral measurement.
A common example is the sharp spectral separation or blue/yellow approach [7], which is often used to describe the color variation of phosphor-converted white LEDs.
Blue/yellow rayfiles for phosphor converted white LEDs
The goniophotometric measurement has to be done twice; once with a blue and once with a yellow filter. Each rayfile contains a sharp separated global spectrum. The rayfiles have different spatial and angular resolved amplitudes for each global spectrum and in the end describe a varying spectrum. The measurement time is quite fast and the results are strongly improved compared to one global spectrum, which cannot describe any spectral varying information.
Figure 2a shows the spectrum of the main radiance direction of a neutral white LED (4000 K), which was created based on a measured blue/ yellow rayfile. Besides the small discontinuity at approx. 520 nm, the simulated spectrum seems to look physically correct compared to the measurement of the identical LED. The sharp spectra in figure 2b are the global spectra of the blue/ yellow rayfile and their associated chromaticity coordinates, which define the blue/yellow mixing line in figure 2c. The ratio of the blue/yellow rayfiles is able to shift the chromaticity along the line. The small misalignment between the blue/yellow line and the line of the measured spectra is due to the difference of the sharp global spectra from the real physical basis spectra of LED and phosphor. This methodical inaccuracy is also the reason for the discontinuity of the simulated spectrum in figure 2a.
The absolute impact of this methodical error depends on the degree of spectral overlap of the true physical basis spectra. If the overlap is stronger, the error gets larger. That is also the reason for the limitation of the sharp spectral method to classic blue/yellow LEDs.
 at main radiance direction (θ = 0°), global blue/yellow spectra (b), and their associated mixing line in the chromaticity diagram (c)") Figures 2a-c: Blue/yellow - reconstructed spectrum (a) at main radiance direction (θ = 0°), global blue/yellow spectra (b), and their associated mixing line in the chromaticity diagram (c)
Figures 2a-c: Blue/yellow - reconstructed spectrum (a) at main radiance direction (θ = 0°), global blue/yellow spectra (b), and their associated mixing line in the chromaticity diagram (c)
Physical Motivated Basis Spectra (PMBS)
Based on the start-of-the-art, the requirements for a measurement technique, which is able to generate spectral rayfiles of LEDs can be summarized.
Measurement technique requirements to generate spectral rayfiles:
- Short measurement time
- Generally applicable (for instance not limited to blue/yellow)
- Easy to implement without additional hardware investments
- Angular and spatial resolved spectral information
- Spectral accuracy to allow colorimetric/spectral simulations with realistic predictions
Concept and spectral separation
Our concept is basically an extension of the constant basis spectra approach from Jacobs et al. and the blue/yellow approach and also belongs to bottom left of table 1. Our main assumption is that each varying LED ray R, which depends on the spatial position x, y, z and the angular direction θ, Φ can be described as weighted sum of its underlying constant basis spectra S(λ) as shown in EQ 1.
 Since the relative spectral distribution depends on the physical origin, only their relative amplitudes remain as a function of angular and spatial dimension. This assumption is true if the system is in steady state condition and if nonlinear effects as self-absorption or saturation of the phosphor are negligible.
If the individual physical basis spectra are not available, the basis spectra can be approximated quite well, based on at least one spectral measurement of the whole spectrum R(λ). There are advanced phenomenological LED models, which can be used to model all LED basis spectra [8]. The remaining phosphor spectrum can be modeled as smoothed spline. Their general correctness can be tested by a comparison with additional individual spectral measurements at random angular positions.
Spectral reconstruction
During a goniophotometric measurement, the transmission function τ₁ of the filter is multiplied with all weighted basis spectra A·S(λ) and then integrated by the ILMD. This results in the measurement value M₁ for each camera pixel and each angular position as displayed in EQ 2. The variable τSys(λ) includes all remaining transmission and responsivity functions, for instance those of the ILMD, lens or neutral density filters.
 Additional goniophotometric measurements with other transmission filters τi(λ) result in additional measurement values Mi. All equations or rather goniophotometric measurements therefore lead to a system of linear equations, in which everything besides the weighting factors Ai is known. The system is rewritten in its matrix form in EQ 3.
The system of linear equation can be solved if the number of measurement values equals the number of unknown amplitudes, which is the number of basis spectra. In case of a blue/yellow LED two measurements are required. If an additional red LED is added the necessary amount of measurements increases to three. If there are enough measurements, the system can be solved by inverting the matrix, which contains the integrated spectral information and a multiplication with the measurement vector. Finally, the combination of the basis spectra and the amplitudes creates the desired spectral rayfile.
Evaluation of the PMBS method
To prove the potential of the PMBS method we reconstructed and evaluated the spectra of the 4000 K LED. The main radiance direction is visualized in figure 3a. Therefore we used two filter measurements with the off-the-shelf filters XShort(λ) and XLong(λ) and the separated basis spectra of figure 3b. Both rayfiles are recalculated based on EQ 3.
 at main radiance direction (θ = 0°), global basis spectra (b) after spectral separation, and their associated mixing line in the chromaticity diagram (c)") Figures 3a-c: PMBS: Reconstructed spectrum (a) at main radiance direction (θ = 0°), global basis spectra (b) after spectral separation, and their associated mixing line in the chromaticity diagram (c)
Figures 3a-c: PMBS: Reconstructed spectrum (a) at main radiance direction (θ = 0°), global basis spectra (b) after spectral separation, and their associated mixing line in the chromaticity diagram (c)
Figures 4a&b show the chromaticity coordinates, which results from the blue/yellow and PMBS simulations compared to the measurement data in the chromaticity diagram. Due to the much better alignment of the PMBS line (Figure 3c) with the measurement data, the mean chromaticity distance of the simulation is only Δxy = 2·10-3 respectively Δu'v’ = 1·10-3, which is below the region of just noticeable color differences [9]. Figures 4c&d show reconstructed and measured spectra. At the angle θ = 33°, the blue/yellow approach is slightly better than the PMBS method, since the spectrum at this angle was used to determine the sharp global blue/yellow spectra. However, at an angle of approximately θ = 65° the PMBS spectrum is more accurate.
, Chromaticity coordinates of the blue/yellow and measurement (b), simulated and measured spectra at θ = 33° (c), and simulated and measured spectra at θ = 65° (d)") Figures 4a-d: Comparison of blue/ yellow, PMBS and measurement - chromaticity coordinates of the blue/yellow and measurement (a), Chromaticity coordinates of the blue/yellow and measurement (b), simulated and measured spectra at θ = 33° (c), and simulated and measured spectra at θ = 65° (d)
Figures 4a-d: Comparison of blue/ yellow, PMBS and measurement - chromaticity coordinates of the blue/yellow and measurement (a), Chromaticity coordinates of the blue/yellow and measurement (b), simulated and measured spectra at θ = 33° (c), and simulated and measured spectra at θ = 65° (d)
Conclusions
There are measurement techniques, which are capable of generating spectral rayfiles with conventional measurement technology. However, there is often a trade-off between accuracy, applicability and measurement time. We proposed the physical motivated basis spectra (PMBS) approach, which minimizes the measurement amount with respect to the device under test. Most important, PMBS is a general approach. If, for instance, a red LED is added to a blue/yellow spectrum, which might, for example, be necessary to increase the color rendering index, a sharp spectral separation would create large errors. The PMBS method can be used without further restrictions. If PMBS is applied to white phosphor converted LED and compared to the most used state of the art technique, which was specially designed for those LEDs, our results are more accurate.
Acknowledgement:
This work has been supported by the German Federal Ministry of Education and Research (funding program Photonics Research Germany contract number 13N13396).
References:
[1] K. Choi and H. Suk, “Dynamic lighting system for the learning environment: performance of elementary students,” Opt. Express 24(10), A907-A916 (2016)
[2] R. Dürr and U. Streppel, “Rayfiles for non-sequential raytracing,” International Light Simulation Symposium ILSIS, Nuremberg, Germany, 11-24(2012)
[3] Ashdown, “Near-field photometry: a new approach,” J. Illum. Eng. Soc. 22(1), 163-180(1993)
[4] R. Rykowski, “Spectral ray tracing from near field goniophotometer measurements”, Light Eng. 19(1), 23-29, 2011
[5] V. Jacobs, J. Audenaert, J. Bleumers, G. Durinck, P. Rombauts, and P. Hanselaer, “Rayfiles including spectral and colorimetric information,” Opt. Express 23(7), A361-A370(2015)
[6] D. Hansen, S. Paul, and V. Schumacher “LED Measurement to Obtain Polychromatic Raydata and their Value for Simulations”, LpS 2012, Bregenz, Austria (2012)
[7] Osram Opto Semiconductors Application Note, “Importing rayfiles of LEDs from OSRAM Opto Semiconductors”, 2013
[8] F. Reifergeiste and J. Lienig, “Modelling of the temperature and current dependence of LED spectra,” J. Light Vis. Environ. 32(3), 288-294(2008)
[9] K.Bieske and T. Fiebig, “Kombination unterschiedlicher Lichtfarben im Raum: Farbige Schatten,” Licht 2016, Den Haag, Netherland, (2014)
(c) Luger Research e.U. - 2017
