Method and Circuit to Maintain Constant Light Output for LED Luminaires
Article from LpR 66 | page 80: It is difficult to accurately predict the lifetime or the light output degradation of LED luminaires. A Constant Light Output (CLO) operation is implemented in some of the latest drivers. However, there are many factors that require a different algorithm in terms of time rate and forward current values that are usually not taken into account. Prof.Dr.Eng. Stelian Matei, from the Photometry and Electromagnetic Compatibility Laboratory at Electromagnetica SA, proposes and explains a new method is maintaining the luminous flux over the lifetime of the LED luminaire, considering the luminaire global light degradation.
Accurate lifetime prediction or estimation of the light output degradation for LED luminaires is difficult. The reason is the diversity of LED technologies and the particular contribution of the system components such as lens, driver, heatsink, etc., to this process. The life of an LED luminaire is the combined effect of gradual light output degradation caused by material degradation and abrupt light output degradation mostly caused by LED components failure. There are a set of standards defining how LED luminaires can be tested to determine their performance over time.
Standards for LED lifetime testing:
• LM-84-14 and TM-28-14
• IEC 62772 luminaire performance
According to IEC 62722-2-1, the LED luminaires using modules in conformity to IEC 62717 definition, may be declared the lumen maintenance value for the module as the maintenance value of the luminaire. Basically IEC 62722 tolerate replacing LED luminaire lumen maintenance with LED emitting surface as long such data is available. Most of the LED lighting system manufacturers are declaring luminaire lifetime based on this acceptance despite the complexity of this matter. The latest generation of LED drivers is managing this problem by employing a Constant Light Output (CLO) operation. This CLO feature increases the forward current at specific time rate, disregarding overall luminaire performance. Ultimately based on a prediction supposedly applying to any LED technology and luminaire configuration. Unfortunately regardless of the CLO type procedure the method does not compensate real light output degradation of the luminaire even for same type of LEDs, otherwise even the constant light output may not be achieved. In reality there are many factors that require a different algorithm in terms of time rate and forward current values as to maintain a genuine constant light output.
Balanced Light Output (BLO)
To include all combined effects in a CLO operation should require a different procedure otherwise may not be any longer of a preset stepping type. Such a dynamic Balanced Light Output (BLO) method is maintaining the luminous flux over the lifetime of the LED luminaire, considering the real luminaire global light degradation instead of LED projected life. The process starts by establishing a reference, respectively an equivalent value number allocated to the initial luminous flux, may also be called a preset flux, together with an equivalent value number of the light transmission through the diffuser or the optical system (transparency or transmittance) as measured by a sensor. Therefore the reference is a numerical value that is in a mathematical relation to the metrological value of these characteristics. Ultimately these reference values of transmittance and luminous flux are used through a mathematical process to determine the overall level of light degradation of the apparatus. The photometric performance, respectively, the maintenance of the luminous flux over the operating time, is analyzed in relation to the reference values in real time. Finally, the results control the LED’s supply current, through the dimming feature of the power supply in order to balance the difference in respect to the overall initial light output performance.
Light degradation process
Decreasing the light output of a luminaire during operation is mainly caused by depreciation of the light source, the diminution of light transmission through the transparent screen (otherwise diffuser), the reduction of the power of the power supply and the ambient temperature conditions. Short term light depreciation is mainly caused by LED’s reaching the thermal balance (Figure 1). Since the forward voltage varies with temperature, the output power delivered to LEDs is decreasing toward balance and may be observed if the input power variation of the LED luminaire is recorded. Practically, a welldesigned luminaire, has a very low variation (perhaps 2-3% is acceptable), as a right balance between total LED power and the heatsink size/shape.
 Figure 1: Flux depreciation due to the thermal balance
Long term light output degradation beyond thermal balance is caused by LED’s, the optical material and electronics aging. Measurements of the luminaire’s long term light degradation are carried under strict controlled conditions (basically in a laboratory) in respect to procedures as specified in standards. For lamps and luminaires data collection procedure is specified in LM 84-14 and projection for the luminous flux method stated in TM 28-14. Both these normatives consider the luminaire‘s components contribution, instead of a single LED test data as a proxy.
Estimating Light degradation
Hence, the CLO method uses the data based LM80 report provided by LED manufacturers, then, long term luminous flux maintenance for LEDs is basically estimated by a mathematical process as explained in TM 21, instead of the real one. According to the TM-21-11, values during a minimum of 6,000 operating hours are processed by approximation exponential regression and then statistically estimating the light degradation six times beyond this period.
Approximation by exponential regression is expressed by EQ1:
 (EQ1)
(EQ1)
Where:
t operating time (in hours)
Φ(t) averaged normalized luminous flux at time t
B projected initial constant by the least squares curve-fit of LM-80 data
α decay rate constant derived by the least squares curve-fit of LM-80 data
When the test period is concluded, the data are normalized for each device to a value of 1 (100%) at 0 hours and then averaged within the same data set (Figure 2).
 Figure 2: Normalized lumen output over time
In order to acquire the decay rate for the test period, an exponential last square curve-fit through the average values is performed (Figure 3), in accordance with EQ1.
 Figure 3: Lumen output over time with curve-fit through the average values
To project the luminous flux maintenance beyond test period (6000 hours), TM-21 state the following equation:
 (EQ2)
(EQ2)
Table 1 shows an example of such a result. Otherwise, the results estimate an 80.23% depreciation level for luminous flux after 36,000 hours operating time (Figure 4).
|
Test Condition – 85°C Case Temp |
|
|
Sample size |
10 |
|
Number of failures |
0 |
|
DUT drive current used in the test (mA) |
150 |
|
Test duration (hours) |
6000 |
|
Test duration used for projection (hour to hour) |
1,200 - 6,000 |
|
Tested case temperature (°C) |
85 |
|
α |
6.49255E-06 |
|
B |
1.013505744 |
|
Reported L70(6k) (hours) |
>33000 |
Table 1: Example of test results
 Figure 4: TM-21 time projection derived from 6000 hours testing
It is unlikely that the real behavior during operating hours of the luminaire, in real conditions is known to be predicted beyond a certain range. Obviously light output depreciation of the luminaires is mainly caused by the thermal stress of the LED emitters, but may also be caused by aging or messing up the transparent screen or the optical system. These two combined depreciation processes are difficult to predict, otherwise the result is reducing the level of illumination and affect function of which was employed (Ex.: the safety and security of users in applications such as street lighting). The implementation of a solution to offset these processes is therefore justified; especially for street lighting.
Constant Light Output (CLO)
As explained previously, lumen maintenance beyond the test period is based on a statistical calculation, otherwise called projection method. There are not too many methods to compensate the light output degradation caused by a combination of elements. The CLO method simply periodically increases the current through LEDs in order to compensate a presumed luminaire’s light output degradation. This system compensates a predicted depreciation of luminous flux through a fixed algorithm irrespective to LED technology or environmental conditions to ensure a predefined lighting level during the luminaire's useful life. One of the algorithms may be expressed by EQ3.
One algorithm for compensating light output degradation:
 (EQ3)
(EQ3)
Where:
It forward current at time t
IN nominal forward current
t operation time
τ time constant
Without remote management this means simply increasing the initial power upon installation in order to make up for luminous depreciation. By precisely controlling luminous flux, by means of forward current through LEDs can control the energy necessary to reach the required level (Figure 5).
 Figure 5: Example of CLO control type
Another way is to compensate at a fixed rate, for example 1% for every 7500 operation hours (Figure 6). Obviously both methods do not consider LED type/technology, optics degradation power supply as a complete system and environmental conditions.
 Figure 6: Example of stepping CLO control type
Regardless of the procedure type, the CLO method does not compensate real light output degradation of the luminaire even for the same type of LEDs. Considering that other system elements behave similarly as power supply, lenses, etc., the luminous flux for the LED type degrades differently, mainly as a result of Tj difference.
Dynamic Balanced Light Output (BLO)
Balanced Light Output method is maintaining the luminous flux, therefore the level of illumination, over the lifetime of the LED luminaire, considering the luminaire’s global light degradation instead of LEDs projected. Obviously, an increase in luminous flux is the result of forward current increase through LEDs and consequently, precaution needs to be taken in regards to thermal management. In this regard the heatsink should be designed to accept the maximum LED output power when it reaches maximum balance light output in order to avoid the LED’s junction from overheating. For example a 100 W LED luminaire should have a thermal capability of a 120 W luminaire equivalent to a L80 lumen maintenance at the end of life.
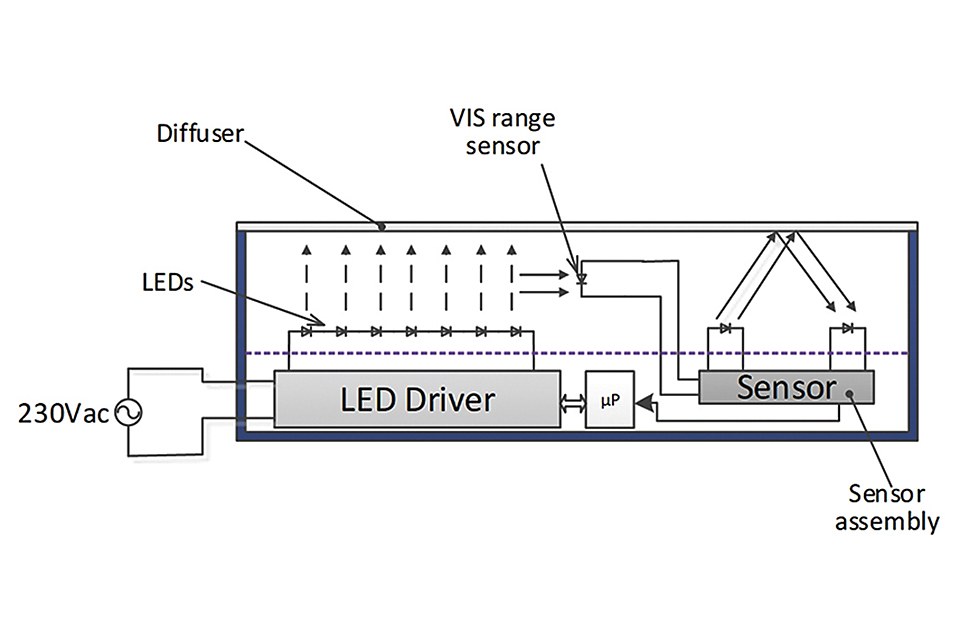
Such a BLO system could be employed inside of a LED luminaire, consisting in principle of a body / assembly as the luminaire’s heatsink having a transparent screen or light diffuser and a LED light source (Figure 7). The light generated by the LED emitters is monitored by a sensor assembly that ultimately controls the power supply driver via a microprocessor. The sensor assembly consists of an IR-infrared emitter-receiver pair, which together detects the transmission through the screen/diffuser. Measurement of the light output generated by the LED emitters inside of the luminaire is performed by a visible VIS sensor.
 Figure 7: Schematic example of a BLO system assembly
The sensors assembly is mounted on the surface of the radiator at some distance from the screen / diffuser (Figure 8). Between the transmitter and the receiver is a technological distance and the VIS sensor is indirectly facing the LEDs (Figure 9).
 Figure 8: Sensor assembly side view
 and the sensor assembly (right)") Figure 9: Reflective wall (left) and the sensor assembly (right)
Figure 9: Reflective wall (left) and the sensor assembly (right)
Suitable arrangement for sensor assembly depend on the mechanical characteristics of the luminaire, respectively the height of the LED emitters, space availability and the type and size of the optics.
The VIS sensor, which is indirectly facing the LED emitters will perform the function of measuring the equivalent value of the total luminous flux. The sensor’s position should allow only the detection of light generated by the LED emitters, which is accomplished by using a reflective wall as in figure 9.
Thus, a ratio between the total lumen output of the luminaire and the electrical signal generated by the VIS sensor can be established for system calibration. The value of this signal is equivalent to the luminous flux value or the reference value for assessing the level of light degradation.
 Figure 10: Sensors assembly top view
 Figure 11: Actual sensors assembly
Transmission of light through the transparent screen (transmittance) is determined by the IR sensors pair. The IR beam generated by the emitter is projected onto the diffuser at the angle α (Figure 12). The intersection with the viewing angle β of the IR sensor on the surface of the screen takes place over the distance D. The intersection surface of the projections of the two cones, respectively, of the sensor, on the surface of the screen is represented by the intersection of two circles corresponding to α and β (Figure 13). When the distance between the transmitter and receiver tends to 0, then L ~ h therefore the projection of the generated beam is practically covered by the viewing angle.
 Figure 12: Transmittance measurement
 Figure 13: Projected areas on diffuser for larger L distance between sensors
Figure 14 shows the trajectory of the IR beam through the transparent diffuser material. The light transmitted by the IR transmitter is reflected in the A direction by the inner surface of the diffuser, but travels in the C direction towards the exterior, throughout the material to the air.
 Figure 14: Projected areas on the diffuser for smaller L distance between sensors
When the diffuser’s material deteriorates, the component in C direction increases (Figure 14) and is redirected inside the diffuser’s material, heading the IR receiver. The damage process is caused by the aging of the transparent material, dirt, deformation, or breakage. The degree of damage may be calibrated by a reflection reference material as applied on the surface of the screen. Such a reference material, also known as the "gray card", should allow for developing a relationship between the degree of damage and the signal produced by the sensor. When the diffuser is new, in the very beginning, the level of the signal is recorded and used in the calculation process as a reference value.
The photometric performance, respectively, the maintenance of the luminous flux over the operating time, is analyzed in relation to the recorded reference values.
The variation of the luminous flux from the initial or reference value is expressed by the equation:
 (EQ4)
(EQ4)
Where:
ΔΦv represents the luminous flux variation
ΦEch the measured flux value
ΦRef the reference flux value
The variation of the transmittance from the initial value is expressed by the equation:
 (EQ5)
(EQ5)
Where:
ΔTv represents the transmittance variation between
TEch the measured value
TRef reference value
Maintaining the luminous flux is achieved by increasing or decreasing the forward current through LED emitters, referring to the reference values of ΦRef and TRef. For a LED current driver this action is equivalent to a dimming function, time related to the light degradation.
Figure 15 illustrates the flow diagram of the BLO computing process. When the luminaire is switched ON, a pulse activates a timer in order to generate pulses every 60 min. Each pulse increment increases the hour counter by 1 in order to record the operating hours. When the hour counter has a value of 1 (n = 1), otherwise the very first operating hour, the initial flux ΦRef and transmittance values TRef are recorded from VIS, respectively, IR sensors. Recording these values (ΦEch, TEch) after the first hour, it can be considered that the luminaire reached the thermal equilibrium and thus the stabilization of the parameters (variables) have been achieved. Moreover, the counter (4) triggers every hour reading variables routine (7), in this order: ΦEch flux reading in (8), followed by reading transmittance TEch in (11). Signal value from the VIS sensor is recorded after each hour in (9). The very first value or the reference ΦRef is stored in (10), only if the block output (6) indicates as a first operating time. Equivalent flux reading is accomplished in (8), every hour. Once the data is released in (9) triggered the block (11) for transmittance measurement whose value is recorded in (13). The mathematical processing, equivalent to the degradation calculation in relation to the reference values (EQ4 and EQ5) are completed in (12).
 Figure 15: Flow diagram of the BLO process
Therefore the results from the flow diagram are:
 (EQ6)
(EQ6)
 (EQ7)
(EQ7)
If
|LF| ≥ 0.2
|LT| ≥ 0.2
When |LF| and |LT| are greater than 0.2, then an alarm signal is generated as the maximum dimming threshold of 20% is exceeded. Both ratios, relative to the reference values are summed up in (14).
Result of (14):
 (EQ8)
(EQ8)
This represents the equivalent numerical value for the overall light output degradation, otherwise essential in the Balance Light Output process. Furthermore, conversion to a PWM dimming signal, as required to control the power supply / driver, is completed in (15) and recorded in block (16), so that it can be saved as it changes with the operating time.
It is advisable that power control not exceed 20% over of the nominal value so that the luminous flux increasing action does not affect the thermal management of the luminaire unless a thermal reserve was provided.
Conclusion
Unfortunately, regardless of the CLO type procedure, the method does not compensate real light output degradation of the luminaire even for the same type of LEDs. The decrease of the lumen output is predicted with a certain tolerance with information LED luminaire manufacturers gathered from past products launched and marketed.
The Balance Light Output (BLO) option offers guarantied constant light levels through luminaire lifetime. Hence, the driver’s dimming feature, combined with the BLO platform, enables the environment to have a constant light output. The driver controls the power provided to the LEDs ensuring an equal lighting intensity throughout the lumen depreciation period.
Therefore, BLO features take account of:
• Global depreciation curve of the luminaire, based on the real time
measurement
• Provides luminaire real lumen maintenance not predicted by
photometry during lifetime of the product
• Avoids site over lighting situation that would be happening with
standard LED lights for half of product’s useful life
• Autonomous, no input needed from the customer
• Customized program
The BLO option now provides the possibility of adapting an LED power supply to the lumen depreciation curve for the product’s entire life cycle.
