New Glass-Based Phosphors for White Light-Emitting Diodes
Phosphors were always the key component of high quality white LED light. With the increased effîcacy and the higher power capabilities of blue high power LEDs, the phosphors become even more important for reliability, color consistency and overall light quality. Franziska Steudel, Florian Wagner, A. Charlotte Rimbach, Bernd Ahrens, Peter W. Nolte and Stefan Schweizer, scientists at the Fraunhofer Application Center for Inorganic Phosphors, a Branch Lab of Fraunhofer Institute for Microstructure of Materials and Systems IMWS, investigated different glass and ceramics based phosphors for white LEDs.
Most white light-emitting diodes (LEDs) consist of a blue LED chip directly coated with an organic polymer containing a yellow phosphor. Heat-induced degradation of the polymer- based encapsulation results in an efficiency decrease and color temperature change of the LED. The growing heat generation results from increasing electrical currents used to drive the LEDs, thus making thermal management a key parameter for LEDs. Therefore, not only temperature-stable phosphors, but also phosphors having a good thermal diffusivity are required. Luminescent glasses or glass ceramics might represent an attractive alternative to LED phosphor due to their higher thermal and chemical stability. Within the framework of this research, luminescent properties and the thermal diffusivity of lanthanide single- and double-doped glasses and glass ceramics are investigated. The thermal diffusivity of the glass ceramics is one order of magnitude higher than that of the glasses, making the glass ceramics comparable to conventional Ce:YAG phosphors.
Introduction
The demand for high luminous flux of LEDs results in increasing operating currents and thus to a growth of the power density of the LED. Although current LEDs are highly efficient, the inevitable losses result in a heat up of the system, causing a spectral shift of the LED emission and a decrease in efficacy and reliability. In phosphor-based LEDs additional efficiency losses arise due to the heat generated from the Stokes shift. Thus, the efficacy of high power white LEDs strongly depends on the thermal management. There exist several methods to maintain a low junction temperature by active and/or passive cooling, but all of them are at the back of the blue emitting LED chip, which implies that the highest temperature within phosphor- converted LED packages is within the phosphor. Even in case the junction temperature of an LED chip is kept below 60°C, the polymer- based phosphor can reach temperatures of more than 80°C for an operating current of 1000 mA [1]. Hence, the LED phosphors do not only require high thermal stability, i.e. high quenching temperatures, but also high thermal diffusivity to efficiently dissipate the heat generated in the phosphor. Conventional polymer-based phosphors have a relatively low thermal diffusivity of approximately 0.2 · 10-6 m2/s [2]. Higher thermal diffusivities, however, lead to a lower phosphor temperature [3].
Luminescent glasses represent an attractive alternative as LED phosphor. Tb3+ and Eu3+ doped borate glasses have a good thermal stability as well as quantum efficiency values higher than 85 % [4]. In addition, the color coordinates of double-doped glass can be varied over a broad spectral range. Within the framework of this paper, these glasses are thermally processed to glass ceramics. The luminescence properties of the glasses and glass ceramics are compared and the thermal diffusivity is analyzed.
Experimental Details
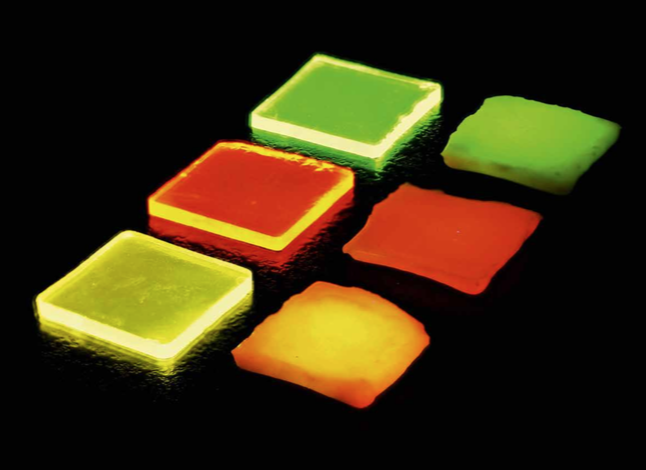
Borate glasses were prepared using lithium oxide (Li2O) and aluminum oxide (Al2O3) as network modifier. A ratio of three moles of boron oxide (B2O3) to two moles of network modifier was used. The glasses were additionally doped with europium oxide (Eu2O3) and/or terbium oxide (Tb4O7). The nominal composition of the samples is as listed in Table 1. The chemicals were weighed in a platinum gold crucible (Pt/Au 95/5) and melted at 1000°C for approximately 3 h. The melt was then poured onto a brass block at 400°C, which is below the glass transition temperature of undoped lithium borate glasses of Tg = 459°C (Section "Thermal properties"). The glass was kept at this temperature for 3 h to eliminate residual mechanical and thermal stress before allowing it to slowly cool to room temperature. The glass samples were then cut into squares of 15×15 mm with thicknesses varying between 1.0 mm and 1.8 mm and polished to optical quality (Figure 1, left). To initiate crystallization, the samples were annealed at a temperature of 530°C for 10 min. This is in analogy to the procedure reported by Appleby et al. [5]. The glass ceramics are shown in Figure 1, right.
") Table 1: Nominal composition of the investigated samples (lanthanide = Ln3+)
Table 1: Nominal composition of the investigated samples (lanthanide = Ln3+)
 and glass ceramics (right): Tb3+ doped (top), Eu3+ doped (middle), and Tb3+/Eu3+ double-doped (bottom) under ultraviolet irradiation") Figure 1: Ln3+-doped borate glasses (left) and glass ceramics (right): Tb3+ doped (top), Eu3+ doped (middle), and Tb3+/Eu3+ double-doped (bottom) under ultraviolet irradiation
Figure 1: Ln3+-doped borate glasses (left) and glass ceramics (right): Tb3+ doped (top), Eu3+ doped (middle), and Tb3+/Eu3+ double-doped (bottom) under ultraviolet irradiation
Differential scanning calorimetry (DSC) was performed with a commercial system suited for temperatures up to 1700°C (Netzsch DSC 404 F1 Pegasus). The samples were cut into small pieces of about 25 mg, ground in a mortar to a fine powder, and then filled in a platinum rhodium crucible (Pt/Rh 80/20). An empty crucible was used as a reference. The temperature was increased with a heating rate of 10 K/min. The nitrogen flow was set to 20 ml/min during the measurements. The onset method was applied to obtain the characteristic temperatures summarized in Table 2, except for Tp. Here, the peak value is used.
The thermal diffusivity was analysed by means of lock-in infrared (IR) thermography. The IR camera (InfraTec ImageIR 8380S) comprises an indium antimonide (InSb) focal plane array (FPA) snapshot detector with a geometric resolution of 640×512 px and a spectral range for detection from 2.0 μm to 5.7 μm. The samples were periodically excited with a 980 nm laser diode (THORLABS L980P100) with a maximum power of 100 mW directly focused to the centre of the sample. The laser and the IR camera are connected to a lock-in box which synchronizes the image capturing with the laser pulses at a certain lock-in frequency, f. The entire setup is placed in a closed sample chamber, entirely in black, to screen it from external thermal radiation.
Photoluminescence (PL) measurements were performed with a commercial quantum yields measurement system (Hamamatsu C9920-02G) coupled to a 3.3 inch integrating sphere with a xenon lamp (150 W) as excitation source and a photonic multichannel analyser (Hamamatsu PMA 12) as detector.
, Tb3+ doped (green), Eu3+ doped (orange), and Tb3+/Eu3+ double-doped borate glass (blue)") Figure 2: DSC data of the undoped reference glass (black), Tb3+ doped (green), Eu3+ doped (orange), and Tb3+/Eu3+ double-doped borate glass (blue)
Figure 2: DSC data of the undoped reference glass (black), Tb3+ doped (green), Eu3+ doped (orange), and Tb3+/Eu3+ double-doped borate glass (blue)
, onset glass crystallization temperature (Tx), peak glass crystallization temperature (Tp), and the different onset glass melting temperatures (Tm). All values are given in °C") Table 2: Thermal properties of the investigated glasses: onset glass transition temperature (Tg), onset glass crystallization temperature (Tx), peak glass crystallization temperature (Tp), and the different onset glass melting temperatures (Tm). All values are given in °C
Table 2: Thermal properties of the investigated glasses: onset glass transition temperature (Tg), onset glass crystallization temperature (Tx), peak glass crystallization temperature (Tp), and the different onset glass melting temperatures (Tm). All values are given in °C
Results and Discussion
Thermal properties
The DSC curves of the glass samples are as shown in Figure 2. The obtained characteristic temperatures are summarized in Table 2. The undoped glass sample shows an increasing heat flow at approximately 460°C, which represents the glass transition temperature, Tg. At a temperature of Tx = 587°C, the onset of an exothermic peak is observed with its maximum at Tp = 608°C. This peak is due to glass crystallization. Between 700°C and 800°C, three endothermic peaks occur, which originate from the glass melting process.
Upon single-doping with Tb3+ or double-doping with Tb3+/Eu3+ the glass transition temperature and the peak glass crystallization temperature do not show significant changes with respect to the undoped glass whereas for the Eu3+ single-doped glass the glass transition temperature and the peak glass crystallization temperature increase by approximately 10°C and 20°C, respectively. Note, that in the double-doped glass the Eu3+ concentration is lower than the Tb3+ concentration for color management reasons. The onset glass crystallization temperature and the melting behavior of the glasses are significantly affected by the lanthanide ions. The lowest Tx is obtained for the double-doped glass, closely followed by the Tb3+ single-doped glass. The Eu3+ single-doped glass has the highest onset glass crystallization temperature. The first glass melting peak, Tm1, is similar for all four glasses at approximately 705°C. The second glass melting peak at approximately 725°C increases in intensity for the Tb3+ single-doped and the Tb3+/Eu3+ double-doped glass compared to the undoped glass. For the Eu3+ single-doped glass, this second melting peak is not observed. Either this phase does not exist as a result of crystallization in Eu3+ single-doped glass or the peak is shifted to lower temperatures and merged with the first peak. For both, the Eu3+ and the Tb3+ single-doped glass, broader endothermic peaks arise at 760°C and at 850°C, respectively. The broad shape of these peaks indicates evaporation of glass material [6, 7]; it is known that boron vaporizes at high temperatures [8].
The thermal diffusivity, σ, of the glasses and glass ceramics is analyzed by means of lock-in infrared thermography. The samples are periodically excited from the front side with a laser diode, which generates thermal waves in the material. The phase delay of the wave, φ, is recorded at the backside of the sample and can be expressed as [9, 10]:

with r the thickness of the sample and f the (lock-in) frequency of the laser pulse. In Figure 3, left, the experimentally determined phase delays (symbols) and the corresponding fitting curves (solid lines) are shown. Due to the detection limit of the IR camera, only phase delays obtained for amplitude signals larger than 10 mK, can be precisely determined, resulting in different possible values for the lock-in frequency, f. The glasses have phase delays of approx. φglass ≈ 70° to 180°, whereas the glass ceramics (GC) show phase delays of φGC ≈ 20° to 60°. Note, that the phase delays in Figure 3, left, are not corrected for sample thickness. Re-arranging Equation 1 leads to a thickness- corrected phase delay, which is directly proportional to the thermal diffusivity, σ:

This relationship is shown in Figure 3, right. Here, the thermal diffusivities can be directly obtained from the slopes, which coincide with the values obtained from the fit of Equation 1 within the fitting error. The thermal diffusivities for the glasses and the glass ceramics obtained from the fits amount to σglass ≈ (0.4 to 0.6)·10-6 m2/s and σGC ≈ (6 to 16)·10-6 m2/s, respectively. Hence, the crystallization of borate glasses to borate glass ceramics increases the thermal diffusivity by more than one order of magnitude. Comparison of the results to literature values, reveals a higher thermal diffusivity of the glass ceramics than conventional Ce:YAG (σ ≈ 4·10-6 m2/s [11]).
 and thickness-corrected (right) phase delay of glasses and glass ceramics (symbols) as well as the corresponding fitting curves (solid lines)") Figures 3: Measured (left) and thickness-corrected (right) phase delay of glasses and glass ceramics (symbols) as well as the corresponding fitting curves (solid lines)
Figures 3: Measured (left) and thickness-corrected (right) phase delay of glasses and glass ceramics (symbols) as well as the corresponding fitting curves (solid lines)
 and glass ceramics (orange curve) doped with Tb3+ (top), Eu3+ (middle), and Tb3+/Eu3+ doped (bottom). All emission spectra are recorded under 376-nm excitation") Figure 4: Emission spectra of glasses (black curve) and glass ceramics (orange curve) doped with Tb3+ (top), Eu3+ (middle), and Tb3+/Eu3+ doped (bottom). All emission spectra are recorded under 376-nm excitation
Figure 4: Emission spectra of glasses (black curve) and glass ceramics (orange curve) doped with Tb3+ (top), Eu3+ (middle), and Tb3+/Eu3+ doped (bottom). All emission spectra are recorded under 376-nm excitation
Luminescence properties
The normalized emission spectra for 376 nm excitation are shown in Figure 4. The energy levels involved are indicated. The Tb3+ doped glass (black curve) and glass ceramic (blue curve) show the characteristic Tb3+ emissions in the green spectral range, with peaks at 490 nm, 543 nm, 583 nm, and 622 nm, which can be assigned to transitions from the excited state 5D4 to the ground state levels 7FJ (J = 6, 5, 4, and 3), respectively. The typical Eu3+ emissions in the red spectral range are caused by transitions from the excited state 5D0 to the ground state levels 7F0 to 7F4 (580 nm to 700 nm). The electric-dipole transition 5D0 to 7F2 at 613 nm is hypersensitive to variations in crystal symmetry [12]. The high intensity of this transition in borate glass indicates the amorphous nature of the matrix material with low inversion symmetry for the Eu3+ ion. Both emission spectra of the single-doped glass and glass ceramic have the same spectral behavior. In contrast, the Tb3+/Eu3+ double-doped glass shows a change in emission intensities upon crystallization. The intensity of the typical Tb3+ emissions is lower, while the intensity of the Eu3+ emissions is higher in the glass-ceramic sample, which results from an increased energy transfer from Tb3+ to Eu3+. This red shift in the emission spectrum can clearly be seen in Figure 1: The double-doped glass has a yellow color impression, while the glass ceramic has an orange one. Additionally, in the double- doped glass ceramic the Eu3+ emission bands show Stark-splitting and the ratio between the transitions 5D0 to 7F2 (613 nm) and 5D0 to 7F1 (592 nm) decreases compared to the single-doped glass ceramic. Both effects originate from a change in the crystal field around the Eu3+ ions, i.e., a part of the Eu3+ ions is possibly incorporated into the crystals. For the double-doped glass ceramic, the degree of crystallization is probably higher than that for single-doped glass ceramics due to lower glass crystallization temperatures Tx and Tp.
Conclusion
The thermal diffusivity of Tb3+ and Eu3+ single-doped and Tb3+/Eu3+ double-doped lithium borate glasses and glass ceramics was analyzed. Processing the glasses to glass ceramics increases the thermal diffusivity by more than one
order of magnitude, i.e. from
σglass = (0.4 to 0.6)·10-6 m2/s for the glasses to σGC = (6 to 16)·10-6 m2/s for the glass ceramics, making it comparable to the conventional Ce:YAG. The emission spectra of the single- doped glasses do not change upon crystallization, whereas the emission spectra of the double-doped glass ceramic reveal an increase in energy transfer from Tb3+ to Eu3+.
Acknowledgement:
The authors thank the “Ministerium für Innovation, Wissenschaft und Forschung des Landes Nordrhein-Westfalen” for its financial support to the Fraunhofer Application Center for Inorganic Phosphors in Soest as well as to the South Westphalia University of Applied Sciences within the FH STRUKTUR 2014 project “LED-2020”.
References:
[1] F. P. Wenzl, P. Fulmek, C. Sommer, S. Schweitzer, W. Nemitz, P. Hartmann, P. Pachler, H. Hoschopf, F. Schrank, G. Langer, J. Nicolics. Impact of extinction coefficient of phosphor on thermal load of color conversion elements of phosphor converted LEDs. Journal of Rare Earths 32, 201 - 206 (2014)
[2] AZoM. Silicone Rubber. October 28, (2015), http://www.azom.com/properties.aspx?ArticleID=920. Accessed June 03, 2016
[3] P. Fulmek, J. Nicolics, W. Nemitz, S. Schweitzer, C. Sommer, P. Hartmann, F. Schrank, F. P. Wenzl. The impact of the thermal conductivities of the color conversion elements of phosphor converted LEDs under different current driving schemes. Journal of Luminescence 169, 559-568 (2016)
[4] F. Steudel, S. Loos, B. Ahrens, S. Schweizer. Luminescent Glasses and Glass Ceramics for White LEDs. LED professional Review 55, 48-51, (2016)
[5] G. Appleby, A. Edgar, G. Williams, P. Vontobel. Structure and neutron imaging characteristics of lithium borate-barium chloride glass-ceramics, Nucl. Instrum. Methods Phys. Res. Sect. A: Accel. Spectrom. Detect. Assoc. Equip. 564 (1), 424-430 (2006).
[6] T. Hatakeyama, F. X. Quinn. Thermal Analysis: Fundamentals and Applications to Polymer Science, second ed. John Wiley & Sons Ltd (1999)
[7] L. A. Hansen, F. J. Frandsen, K. Dam-Johansen, H. S. Sørensen. Quantification of fusion in ashes from solid fuel combustion. Thermochim. Acta 326 (1-2), 105-117 (1999)
[8] M.E. Brown, P.K. Gallagher. Handbook of Thermal Analysis and Calorimetry. Applications to Inorganic and Miscellaneous Materials, Vol. 2. Elsevier B. V. (2003)
[9] C. Schmidt, F. Altmann, O. Breitenstein. Application of lock-in thermography for failure analysis in integrated circuits using quantitative phase shift analysis. Materials Science and Engineering: B 177, 1261-1267 (2012)
[10]L. I. Giri, S. Tuli, M. Sharma, P. Bugnon, H. Berger, A. Magrez. Thermal diffusivity measurements of templated nanocomposite using infrared thermography. Materials Letters 115, 106–108 (2014)
[11] Scientific Material Corporation, Laser Materials Ce:YAG http://www.scientificmaterials.com/products/ce-yag.php.Accessed June 03, 2016.
[12] G. Blasse, B.C. Grabmaier. Luminescent Materials, Springer-Verlag, (1994)
(c) Luger Research e.U. - 2017
