Temperature Profiling of Secondary LED Optics by Infrared Thermography
Over the last few years, the power density of white LEDs has increased dramatically. Whilst there are large efforts to optimize the thermal management and thus the temperature stability of the LEDs, less attention is paid to the temperature of the secondary optic. Peter W. Nolte, Franziska Steudel, Bernd Ahrens, Nils J. Ziegeler, Frank Drees, Horst Rudolph, and Stefan Schweizer from the Fraunhofer Application Center for Inorganic Phosphors, the South Westphalia University of Applied Sciences, and the Innovations-and Technologycenter GmbH, TRILUX Group respectively, have approached this issue. They investigated the temperature profiles of polymethyl methacrylate (PMMA) and polycarbonate (PC) secondary optics and they discuss the results.
If the secondary (polymer-) optic is permanently operated at high temperatures, its optical properties or even its geometry might change. Therefore, it is important to have an exact knowledge on the temperature profile within the secondary optic. Here, the temperature profile of a secondary polymer optic is analyzed in combination with a high-power LED module by infrared thermography. Two different materials for the secondary optic are investigated: polymethyl methacrylate (PMMA) and polycarbonate (PC).
In the experiments, the temperature of the LED module is set to 85°C with an external temperature controller. To examine the temperature profile within the optic, a cross-sectional cut is prepared and the surface is polished to optical quality. The investigation yields the exact temperature profile within the optic. In particular, the temperature at the inner surface is determined precisely.
Introduction
As power dissipation and thermal robustness of LEDs rise, their power density and temperature, in particular the phosphor temperature, increases as well. While modern LEDs are designed to withstand high temperatures, it has to be made sure that their application environment also keeps up with this trend. A higher temperature stability of the LED and the primary optic might result in conditions, where the temperature of the secondary optic exceeds its specified working temperature range. This is of particular interest if the secondary optic is made out of a polymer. The heat distortion temperature (HDT) of the commonly-used materials for secondary optics, such as polymethyl methacrylate (PMMA) and polycarbonate (PC) is at 95°C [1] and 122°C [2], respectively (both values according to ISO 75 at 1.8 MPa). If the secondary optic is permanently operated above these temperatures, its optical properties might degrade [3]. In a worst-case scenario, even a deformation is possible. While glass optics are certainly an alternative, polymer optics are preferred by lighting manufacturers due to their lower cost and weight. An exact knowledge on the temperature profile within the secondary optic is thus crucial for high-power LED applications.
Experimental Details
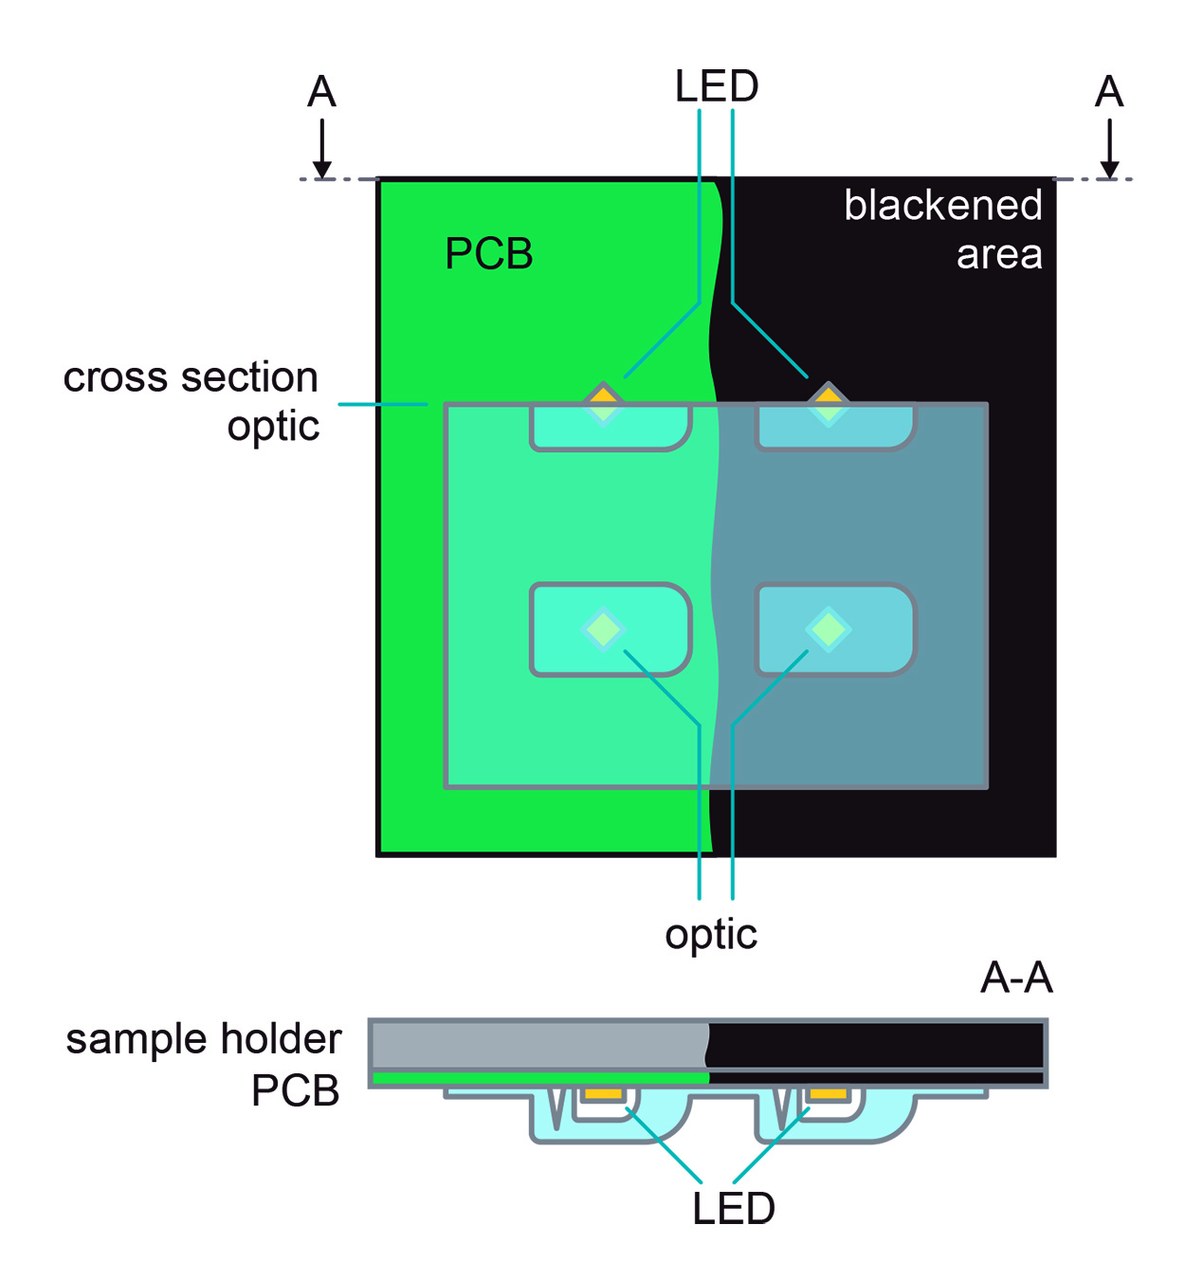
The temperature profile of two secondary optics made of PMMA and PC in combination with a high-power LED module are investigated. Both optics have identical geometry and differ only in material. Figure 1 shows a scheme of the used LED module and the geometry of the optic. The LED module consists of four high-power LEDs on a printed circuit board (PCB) with an aluminum core (Figure 1, left). The LEDs are connected in series and arranged in a square 2x2 array.
In Figure 1, The LED module and the secondary optic are mounted on a sample holder with external heating. One half of the PCB is painted in black to enhance the emissivity. The secondary optic is shaded in blue. For some experiments, a cross-sectional cut is performed along the symmetry axis of the optic. This allows to measure the temperature profile within the optic (Figure 1, right). In this case, two of the LEDs are fully covered, while the other two are only half covered by the optic. The whole setup is mounted on a sample holder, which is equipped with a heater and a temperature controller. To control the operation current of the LEDs and to measure the electrical power consumption a source measure unit (Tektronix Keithley 2600) is used.
Transmittance measurements in the visible spectral range are carried out using a UV-Vis-NIR spectrophotometer (Agilent Technologies Cary 5000). The LED emission spectrum is recorded with an absolute photoluminescence quantum yield measurement system (Hamamatsu C9920-02G).
Measurements of the temperature distributions in operation are performed with an infrared (IR) thermography camera (InfraTec ImageIR 8380S), which uses an indium antimonide (InSb) focal plane array (FPA) snapshot detector with a geometric resolution of 640x512 px. The spectral range for detection is between 2.0 μm and 5.7 μm.
In principle, infrared thermography allows a precise measurement of the radiation intensity only. However, if the emissivity value for the surface of the investigated material is known, the exact temperature can be deduced. Parts of the LED module are thus painted in black. This ensures for the painted areas in very good approximation a homogeneous black-body emissivity of ε = 1.0.
It is obvious that the approach of a painted reference point is not reasonable to determine the temperature of the polymer optic. The painted part of the optic would lead to an additional temperature increase, since the visible part of the LED emission would be absorbed by the black paint resulting in false temperature values. Thus, the emissivity values of both polymers are estimated as follows: First, the transmission and reflection spectra are recorded in the near infrared spectral range with a Fourier transform infrared spectrometer (Bruker Vertex 70 with a combined transmission and specular reflection unit A510/Q-T). On the basis of these data, the spectral absorbance is calculated, weighted with the black body spectrum, and then integrated for the sensitivity range of the thermography camera, i.e., in the spectral range from 2.0 μm to 5.7 μm. Finally, the integrated absorbance is compared to the integrated emission intensity of a black body in the same spectral range; the ratio of these values approximates the emissivity of the sample. For PMMA as well as PC an emissivity value of ε = 0.95 is found.
The thermographic images shown in this work are all corrected for the emissivity of the material. To mimic the operation in a warm environment, the sample holder is kept at a constant temperature of 85°C. This is the maximum reference temperature for the LED system. The current of the LED module is set to 1050 mA, the voltage amounts to 12.5 V. This leads to an electrical power consumption of about 13 W for the total LED array. Prior to the thermographic measurements, the module is run for two hours to reach thermal equilibrium.
Experimental Results
Thermographic imaging of the LED module
Figure 2 shows a thermographic image of the LED module without secondary optic. In this image, the blackened part of the PCB (compare Figure 1) is seemingly warmer than the other. This is due to the larger emissivity (ε = 1.0) of this area compared to the unpainted one. In fact, the entire PCB is at the same temperature of 85°C. As proven in preceding investigations, the LED itself has an emissivity of ε = 1.0. In this experiment, the surface temperature of the LEDs reaches an average value of 125°C.
 Figure 2: Thermographic image of the LED module without secondary optic. The right half of the board is painted in black
Optical properties of PMMA and PC
Figure 3 shows the transmission spectra of PMMA (black) and PC (blue) in the visible (left) and the near-infrared (right) spectral range. In addition, reflection and scattering spectra are recorded (not shown), so that the absorbance can be estimated. The emission spectrum of the white LED in the visible spectral range is shown on the left in orange color. The spectrum comprises the relatively narrow blue emission at 439 nm from the LED itself and the broad yellow emission from 470 nm to 750 nm from the phosphor. On the right, the emission spectrum for a black body at a temperature of 125°C (dark red) is shown for comparison. This represents the infrared radiation from a LED at this temperature.
 as well as the LED emission spectrum (orange)") Figure 3: Transmittance of PMMA and PC (black and blue) as well as the LED emission spectrum (orange) and the black-body curve for a temperature of 125°C (dark red). The left panel shows the spectra in the visible range, whereas the right panel shows the near-infrared part. The LED emission spectrum and the black-body curve are each normalized to the maximum intensity and thus not to scale
Figure 3: Transmittance of PMMA and PC (black and blue) as well as the LED emission spectrum (orange) and the black-body curve for a temperature of 125°C (dark red). The left panel shows the spectra in the visible range, whereas the right panel shows the near-infrared part. The LED emission spectrum and the black-body curve are each normalized to the maximum intensity and thus not to scale
Both polymer optics show excellent optical properties in the visible spectral range. The transmittance is almost constant over the entire visible spectral range. At a wavelength of 500 nm, it amounts to 92% and 90% for PMMA and PC, respectively. Since the reflectance is 8% and 10% for PMMA and PC, respectively, the absorbance is estimated to be in the order of the measurement accuracy of 1%. However, a more precise knowledge of the absorbance is necessary to allow an accurate estimate of the power absorbed by the polymer. This is of particular importance for high-power LED applications as it is the case here.
The slightly better transmission property of PMMA is due to its lower refractive index, n. At a wavelength of 500 nm, a typical refractive index of PMMA and PC is nPMMA = 1.496 [4] and nPC = 1.597 [4], respectively.
For perpendicular incidence and considering multiple reflections, the resultant transmittance, T, of two polymer interfaces in air (nair = 1) is given by
T = 2n/(n2 + 1) (EQ1)
This leads to a theoretical transmittance of 92.4% and 90.0% for PMMA and PC, respectively. The ultraviolet absorption band of PC is at 394 nm, whereas that of PMMA is deeper in the ultraviolet, i.e., at 373 nm. This might be an issue if the LED emission spectrum has a significant part also in the ultraviolet spectral range.
However, in the near-infrared spectral range the transmittance vanishes for a large part of the spectrum. For both polymers, noticeable transmittance is only found for wavelengths shorter than 4 μm. The spectral reflectance (not shown here) is mostly constant in the spectral range investigated and amounts to approximately 7%. Thus, the blackbody radiation, originating from the PCB and the LEDs, is almost completely absorbed for wavelengths longer than 4 μm.
Thermographic imaging of a cross-sectional cut through the polymer optic
To measure the temperature profile inside the optic, a cross-sectional cut is fabricated with the surface polished to optical quality.
Figure 4 shows the temperature distribution of a cross-sectional cut of one of the investigated optics. The LED module is operated with the optic (indicated by a white frame) facing downwards.
") Figure 4: Thermographic image of a cross-sectional cut through the polymer optic (PC). The marked area is shown enlarged in Figure 5. The module is analyzed upside down as depicted in Figure 1, bottom part
Figure 4: Thermographic image of a cross-sectional cut through the polymer optic (PC). The marked area is shown enlarged in Figure 5. The module is analyzed upside down as depicted in Figure 1, bottom part
Figure 5 enlarges the area of interest. Characteristic positions within the cross-sectional cut are labelled. Position 1 lies within the PCB. Having passed the white-yellowish hotspot from the LED, position 2 indicates a location within the cavity of the optic, while position 3 marks the inner surface of the optic. Position 4 indicates the outer surface of the optic, i.e., the polymer-to-air interface.
") as indicated in figure 4. The temperature profile along the white line is shown in figure 6
as indicated in figure 4. The temperature profile along the white line is shown in figure 6
The vertical white line through the center of the LED serves as reference for the temperature profile inside the optic, as shown in Figure 6.
 Figure 6: Temperature profile of the investigated PMMA and PC optics. The positions 1 to 4 are consistent to the positions indicated in Figure 5
Analysis of the temperature profile within the polymer optic
For both polymers (PMMA and PC), the temperature profile through the optic can be seen in Figure 6. At the bottom of the cavity (z = 1.8 mm), both polymers are at the same temperature of 82°C. This value is very close to the set board temperature of 85°C. Within the cavity, the temperature falls linearly down to 67.7°C and 66.5°C for PMMA and PC, respectively, at the boundary to the bulk (z = 5.5 mm). Within the bulk, it becomes more obvious that the temperatures diverge due to the different thermal conductivities of λPMMA = 0.19 W/(m·K) [5] and λPC = 0.20 W/(m·K) [6]. At the cavity-to-bulk interface, the temperature shows a slight increase, followed by a significant drop by approximately 7°C. From there on, the temperature again decreases linearly to 52.6°C and 49.4°C for PMMA and PC, respectively, at the outer surface of the optic (z = 10.5 mm).
Three mechanisms are contributing to the heating of the optic:
• A significant contribution is given by thermal conduction since the secondary
optic is in direct contact with the PCB. The PCB itself is kept at a constant
temperature of 85°C by an external heater
• A further contribution is due to convection. The air within the cavity is heated by
the LED and the PCB, and there is convective heat transfer to the cavity-to-bulk
interface
• The contribution of radiative heat transfer is negligible. Thermal radiation is
typically only important for very hot objects, or for objects with a large
temperature difference, which both is not the case here
Apart from the above-described mechanisms for heat transfer (conduction, convection, and radiation), a significant contribution might be due to absorption of the LED emission in the visible spectral range. Though both polymer optics provide an excellent transmittance in the spectral range of the LED emission, a small, but not negligible part might be absorbed by the optic due to marginal absorption within the optic. Partial absorption of the visible emission is probably the most critical part since the optical output power in the visible spectral range is in the order of several watts, i.e., an absorbance in the order of a few tenths of a percent already results in a heating power of a few milliwatts.
Comparison between cross-sectional cut and complete optic
To prove the suitability of cross-sectional cuts for the temperature profile analysis, a similar experiment is carried out for a complete optic. Again, the LED module is operated with the optic facing downwards. Once the temperature has reached a steady state, the LED module is removed from the optic. During this process, thermographic images are taken every 50 ms. The time scale to remove the LED module is in the order of a few hundreds of milliseconds. For such a short period of time, the temperature of the optic shows only a negligible decrease and is in the order of 0.1°C. Figure 7 shows the temperature distribution of the inner surface of a complete optic having removed the LED module. At the position of the optics cavity, the temperature at the cavity-to-bulk interface amounts to approximately 66°C, which is in good agreement to the measurements at the cross-sectional cuts. The use of cross-sectional cuts is thus a suitable method to investigate the temperature profile within a (polymer) optic.
 after operation facing downwards") Figure 7: Thermographic image of the inner surface of the polymer optic (PC) after operation facing downwards. The cooler areas on the left and right side of the image are caused by the mounting of the optic
Figure 7: Thermographic image of the inner surface of the polymer optic (PC) after operation facing downwards. The cooler areas on the left and right side of the image are caused by the mounting of the optic
Conclusions
For the investigated combination of a high-power LED module and a polymer optic, the maximum temperature of the optic lies below the heat distortion temperature of the polymer. However, for smaller distances between LED and optic unwanted effects are expected. The results indicate that even a very low absorbance in the visible spectral range might be detrimental, in particular as LED power densities increase. In addition, the transmission properties of the optic need to be carefully matched with the LED emission spectrum.
Acknowledgments:
The authors wish to thank the "Ministerium for Innovation, Wissenschaft und Forschung des Landes Nordrhein-Westfalen" for its financial support to the Fraunhofer Application Center for Inorganic Phosphors in Soest.
References:
[1] A. Siegmann, M. Narkis, and N. Rosenzweig, Polymer Engineering and
Science 19, 223–225 (1979),
doi: https://www.doi.org/10.1002/pen.76019031010.1002/pen.760190310
[2] A. Brydson, Plastics Materials, 7th Edition, Elsevier LTD, Oxford, 1999
[3] W. D. van Driel and X. J. Fan (Eds.), Solid State Lighting Reliability,
Springer-Verlag New York, 2013,
doi: https://www.doi.org/10.1007/978-1-4614-3067-410.1007/978-1-4614-3067-4
[4] N. Sultanova, S. Kasarova and I. Nikolov, Acta Physica Polonica A 116,
585–587 (2009),
doi:
https://www.doi.org/10.12693/APhysPolA.116.58510.12693/APhysPolA.116.585
[5] M. J. Assael, S. Botsios, K. Gialou, I. N. Metaxa, International Journal of
Thermophysics 26, 1595–1609 (2005),
doi: https://www.doi.org/10.1007/s10765-005-8106-510.1007/s10765-005-8106-5
[6] J. Blumm and A. Lindemann, High Temperatures – High Pressures,
2003/2007, volume 35/36, pages 627–632
