TM-30 or the Quest for New Metrics to Measure Light Color Quality
As the lighting industry’s need for an unambiguous measure of lighting color quality becomes more urgent, the TM-30 test method put forward by the Illumination Engineering Society of America (IES) is one approach that could offer a solution. Arno Grabher-Meyer, Editor in Chief at LED professional gives a quick status overview.
The emergence of energy-saving lighting has galvanized debates about methods of expressing color-quality. LED lighting is the latest and arguably most disruptive of the new technologies to enter general use, offering users tremendously expanded selections of effects and tones.
The Color Rendering Index (CRI Ra), calculated using a method defined by the International Committee on Illumination (CIE), has been the lighting industry’s reference for many years. But although it is easy to understand, it can give confusing results. It is possible for some lamps to gain a high CRI after testing yet deliver illumination that is well below expectations. The need for a new standard test method capable of generating an unambiguous expression of color quality has become urgent.
The Limits of CRI
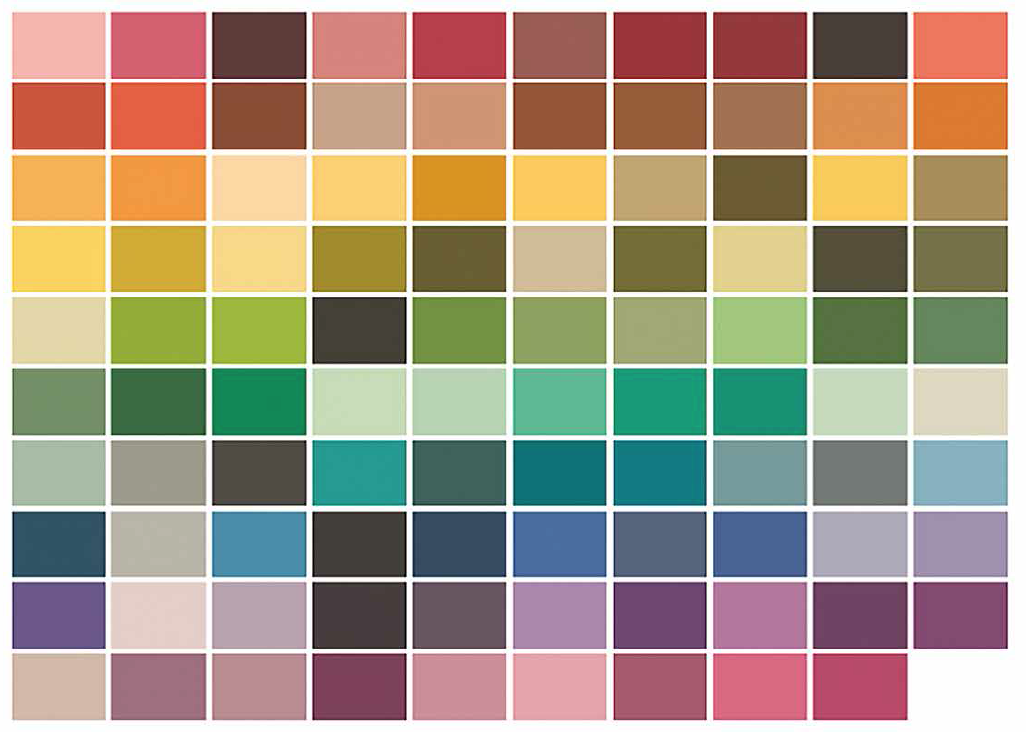
The standard method for calculating CRI uses eight sample colors. These are deemed to be representative of most objects, but in fact are medium-chroma pastel colors (Figure 1). To perform the test, the Correlated Color Temperature (CCT) of the test source is first determined. A reference source of the same CCT is then calculated. The eight standard samples are then illuminated by the test source and the reference source, and their coordinates are found on the CIE Y-U-V color space. The distance between the pairs of coordinates for each sample (Ei) is then calculated and used to generate eight results (Ri) expressing the fidelity for each sample. The arithmetic mean of these values is then calculated to generate the CRI as the average color rendering index (Ra).
One of the strengths of the CRI is its simplicity. As a one-number metric that expresses the quality of a lamp in terms of its closeness to daylight, it is relatively easy to measure and easy for end users to understand.
On the other hand, its simplicity can lead to ambiguity. Because the index is an average with reference to only eight colors, it is possible for a high-scoring lamp to give poor results with other colors; particularly saturated colors (red, yellow, green, blue), as these are not included in the test samples. Accurate rendering of saturated colors, and red in particular, can be important in situations where vibrant effects are desirable, such as merchandising clothes or produce. Faithful rendition of red colors is also important for accurate representation of skin tones and for lighting in health centers and hospitals.
Some LED-lighting manufacturers publish the red-rendering (R9) performance of their products in addition to CRI, and indeed, Energy Star requires qualifying products to achieve a minimum R9 greater than zero and CRI of 80 although the R9 value is often not communicated. Figure 1: CRI test color samples are pastel shades only
More accurate is the CRI according to DIN 6169. It adds four saturated colors, and two colors are representatives of well-known objects. These are usually not part of the CRI value and provide supplementary information.
Another big disadvantage of the CRI metrics is the use of the “2° standard observer” method instead of the 10° observer. In SSL products, the same CRI and CCT can lead to a completely different appearance when the 2° observer is used, even for 1SDCM binning. This becomes better when the 10° observer method is applied. Therefore Osram recently proposed to use the 10° observer system for critical applications [1, 2 ].
The CIE as well as the industry are well aware of the deficiencies of the CRI metrics. Several attempts to improve this system were undertaken from the beginning on. Until now, all were unsuccessful. Even for the most promising predecessor, the R96a method, no consensus could be found and the committee was dissolved in 1999.
LED Lighting Demands Better Metrics
To win customer acceptance for new lighting technologies, vendors have had to justify the quality of the light generated by the new sources and explain how and why the effects differ from those delivered by incandescent lamps. Drawing attention to CRI has helped customers understand how to select lamps that are best suited to their needs.
As a wider variety of end users become familiar with CRI, its shortcomings are becoming more widely appreciated. LED lighting, in particular, has increased the need for urgent agreement on a more robust color-quality metric.
A wide variety of criteria influence the characteristics of light from white LEDs. These include differences between fabrication technologies, as well as various techniques for mixing RGB sources or applying phosphor correction. Moreover, these are subject to ongoing development seeking to reduce costs and optimize productivity. As a result, the white LEDs in the market offer many different versions of “white” light. They can also be engineered to produce favorable results under simple tests such as CRI.
CQS, GAI, TLCI - The Better Choice?
Besides the CRI, more than 25 indices [3] were proposed over time, but most of them did not become serious candidates for replacing CRI; not the Flattery Index (Judd, 1967), the Color Preference Index (Thornton, 1974), the Color Discrimination Index (Thornton, 1972) nor the Cone Surface Area (Fotios, 1997), just to name a few. However, there are also three indices that are sometimes used and published by some US and Japanese SSL manufacturers: CQS, GAI and TLCI.
The CQS method seeks to improve on CRI by standardizing a larger set of test samples including the saturated colors as well as earth colors and a standardized Skin Tone. Moreover, the CQS calculations are structured to prevent lamps that achieve very high fidelity with some colors but give poor results with others from scoring an average good enough to qualify for a high overall index. However, CQS still only tests fidelity. Its capability to describe color rendition accuracy is limited while its strength is in being a measure for color preferences.
The Gamut Area Index (GAI) is calculated by dividing the gamut area formed by the light source with the gamut area formed by the reference source using the same set of colors (R1 - R8) that are used for the color rendering index in the CIE 1976 color space. By definition, any light source with CRI of 100 will have a corresponding GAI. GAI gives information about vibrancy but not about color rendering accuracy. Like CRI, GAI on its own is no indicator of visual preference, and a high GAI does not mean that any color is rendered more vibrant.
Sometimes, but not very often, product information includes TLCI, the Television Lighting Consistency Index. This index has been developed because with the introduction of LED, the television and film production industry recognized huge issues. While CRI and GAI are related to the “human standard observer” and the human visual apparatus continually adjusts to make colors look correct independent of the CCT, this is not the case with cameras. Therefore, TLCI refers to a kind of “standard camera” model including the knowledge about the production process and display. This renders TLCI useless as replacement for CRI.
While these metrics might be slightly better than the current CRI, any proposal has clear weaknesses. None cover all the necessary aspects to become the perfect candidate to replace CRI. No wonder that CIE hasn’t found common understanding for a substitute up until now.
TM-30 - The Way Forward?
The Illumination Engineering Society of America (IES) has suggested the new TM-30 test method, which has been designed to overcome the limitations of fidelity-based metrics such as CRI and CQS. TM-30 addresses perceived shortcomings associated with the color space, test samples, and characteristics of the reference illumination, and generates more detailed metrics that describe not only fidelity but also gamut and a color-vector graphic that helps end users anticipate the lamp’s performance in their intended application.
 consists of 99 different colors") Figure 2: The TM-30 Color Evaluation Samples (CES) consists of 99 different colors
Figure 2: The TM-30 Color Evaluation Samples (CES) consists of 99 different colors
TM-30 uses a more up-to-date color space than the well-known CIE U-V-W two-dimensional space. IES argues that U-V-W does not provide an accurate, uniform representation of three-dimensional color in terms of lightness, chroma and hue.
Instead, the TM-30 test method uses the three-dimensional CIE-CAM02-UCS uniform color space. This is a state-of-the-art color space that has more uniform characteristics than the older U-V-W color space, and is better suited to calculating color differences.
 Figure 3: TM-30 smooths the reference source continuum by blending between 4500 K to 5500 K
Extra color samples
TM-30 also specifies a much larger set of color samples than either the CRI or CQS test methods. In fact, 99 Color Evaluation Samples (CES) have been selected, with spectral properties representative of real objects such as paints, textiles, skin tones and inks. Figure 2 shows the 99 samples. In addition to having been chosen to give uniform coverage of the color space, they have also been selected based on their reflectance properties so as to minimize differences in sensitivity for individual wavelengths. This helps to eliminate naturally occurring sample-related bias. The larger set of samples, with insistence on wavelength uniformity, also helps to prevent selective optimization: that is, deliberately fine-tuning the light source to prioritize a high test score in preference to real-world performance.
Blend of reference sources
As with the CRI test method, TM-30 uses a combination of reference sources with characteristics along the daylight locus at CCT of 5000 K and above, and along the blackbody locus at 5000 K and below. As figure 3 shows, there is a significant difference in the two loci of the two reference sources around 5000 K. TM-30 blends reference sources in the 4500-5500 K range to give a smoother transition that is more in keeping with modern color-tunable sources.
A measure beyond fidelity
Using results from the 99 color samples, and the latest color space and calculation engine, the TM-30 test method generates a value for fidelity, Rf, as the arithmetic mean of the 99 Ri values. This is similar to the way CRI is calculated, although the larger and better-selected range of samples is intended to ensure that the TM-30 Rf is a more accurate measure of fidelity than the Ra value of CRI.
To provide a more in-depth assessment of color quality, TM-30 also expresses the increase or decrease in chroma when testing the 99 color evaluation samples. This is the gamut index, Rg, and is calculated from a color vector graphic that is generated by plotting average chromaticity coordinates in each of 16 hue bins that span the full range of chromaticity. This establishes two sets of 16 averaged points on the chromaticity diagram, representing the responses of the color samples both to the reference light source and the test source. Joining each set of points generates two polygons that express the color gamut for each source respectively, as shown in figure 4. Calculating the difference in area between the two polygons gives the value of Rg for the test source. The color vector diagram showing the two polygons also allows the reader to identify hues that will be more saturated - and those that will be less saturated - compared to the reference source. In bins where the test source polygon is outside the reference polygon, saturation will be greater.
Plugging in the numbers
The TM-30 technical memorandum provides access to online spreadsheets that help calculate and display the results. The results include the fidelity index, Rf, which can be up to 100 similar to the case with CRI. The gamut index, Rg, is also calculated, and can be up to 140. Rg is allowed to be greater than 100 because the test lamp can have a larger gamut than the reference. Rf, as a measure of fidelity, can only be up to 100.
The TM-30 results can also be expressed graphically. The color vector, diagram similar to that shown in figure 4, shows clearly where the test lamp has greater or lower gamut than the reference. This helps identify colors that will show an increase or decrease in chroma.
 Figure 4: The color vector diagram helps compare chroma performance and calculate Rg
Moreover, plotting the values of Rf and Rg on a two-dimensional color rendition diagram gives a graphical representation of the lamp indices that is more descriptive than CRI yet still quite easy to understand. Figure 5 plots Rf/Rg for sources across a variety of technologies.
 Figure 5: Color rendition as described by TM-30 indices
Prospects - Change Ahead?
The IES has been busy explaining TM-30 for groups like specifiers and manufacturers of lighting equipment, since presenting a pair of introductory webinars [4] in September 2015. The method is just beginning its journey aiming to becoming a trusted industry reference. Will manufacturers embrace it? Will specifiers understand it? For manufacturers, the decision may come down to economics: whether the testing can be completed quickly and cost-effectively given the much larger number of color samples and data points, and more intensive processing of the results. Acceptance among specifiers may depend on the way manufacturers present their results. Certainly the graphics can potentially give a better idea whether a lamp will be suited to a given task.
We may all agree with the objectives driving TM-30. The next step could be for manufacturers to step up: start testing, and publish the results. Still the questions if CIE will finally follow the IES proposal and make TM-30 the new international standard remains: Will they refuse adoption or will the related CIE workgroup ask for some changes or further improvements? The chances for TM-30, or at least a revised version of it, to become the new international color metrics standard is better than for any predecessor, as some CIE members were also involved in the development.
Credits:
All figures are adapted from Michael Royer's (PNNL) and Kevin Houser's (Penn State University) DOE+IES Webinar | September 15, 2015 presentation "Understanding and Applying TM-30-15", and from Michael Royer's (PNNL), Aurelien David's (Soraa, Inc.) and Lorne Whitehead's (University of British Columbia) DOE+IES Webinar | September 22, 2015 presentation "A Technical Discussion of IES TM-30-15"
References:
[1] Arno Grabher-Meyer, Light + Building Post Show Report: The Six Most Noteworthy Observations, LED professional Review 55 - May/June 2016, pg. 36
[2] https://www.led-professional.com/products/leds_led_modules/ world-premiere-osram-presents-10deg-binning-for-white-leds-soleriq-s-13-gen-3-at-first
[3] http://energy.gov/eere/ssl/webinar-understanding-and-applying-tm-30-15
[4] http://energy.gov/eere/ssl/downloads/webinar-technical-discussion-tm-30-15
