On the Standardization of Thermal Characterization of LEDs
Unlike two decades ago in the IC world, the junction temperature (Tj) of an LED is not just a performance indicator of the thermal design but also plays a major role in lighting design since many properties of the light output of an LED depend on the absolute junction temperature. This means that thermal management should be an integral part of the system design of an LED based lighting solution, resulting in changing roles of different engineering disciplines in the overall design process - as will be discussed later in more detail.


.")
Introduction
Consequently, since Tj of LEDs is more widely used in the design process of LED-based lighting solutions, well-established definitions of standardized thermal metrics and models will be even more important than before, both for the LED manufacturers and the lighting system designers.
In “Goals of LED Thermal Characterization” the researchers highlight the reliability and general performance aspects of thermal characterization of LEDs, while in “Drawbacks of Current Data Sheets“ some major issues regarding today’s LED data sheets discuss the major questions that should be addressed by a thermal standardization body, and suggest some hints for possible solutions. The Appendix provides outlines of a multi-domain LED model. The need for such a model is well justified by the fact that in case of LED based lighting systems, the light output depends on ‘everything’ as illustrated by Figure 1.
Junction temperature as a performance indicator
As said, a system designer wants to check if a junction temperature or a solder temperature stays within prescribed limits, or, alternatively, needs a temperature value for lifetime prediction. The equation that is most used is the following:![]()
where in daily practice Rth is a number that is supplied by the manufacturer, the power P is usually supplied by the electronic engineer, and and Tref is a reference temperature that depends on the definition: either it is some (unspecified) ambient temperature, or a point on the package or board in question. After the Tj junction temperature has been calculated using eq. (1), this temperature is usually compared to a specified temperature (of which the origin often is unknown). When Tj is higher than Tspecification, the system will be likely redesigned with all the consequences of time-to-market etc. Obviously, one should be really convinced about the accuracy of the calculated Tj before jumping to these kinds of decisions. Questions raised by eq. (1) are discussed in [1] and [2] in detail. At first the thermal resistance in further detail will be addressed, basically from the point of view values provided in data sheets and the way how these values were obtained.
A few words about thermal resistance
The way how the EIA/JEDEC JESD51.1 standard [4] defines the thermal resistance is a re-arrangement of eq. (1):
where Tx denotes the temperature of the reference point X (the same as Tref in the previous equation) and PH denotes the power dissipated in the device - corresponding to P in eq. (1). Though this definition of Rth is not as rigorous as discussed in [1] and [2] when applying eq. (2) for obtaining the thermal resistance of a semiconductor package, also for LEDs the conditions enabling the ‘thermal resistance’ concept need to be precisely understood and checked.
Equation (2) suggests building a spatial temperature difference in thermal equilibrium: heat up the junction and measure both the junction temperature and the temperature at a well-defined reference point X. If the reference temperature is the ambient temperature (that we can control if measurements are performed e.g. on a cold plate), then in the un-heated device, in its initial thermal steady-state Tj0= Tx, i.e. the initial junction temperature and the reference point temperature are equal.
After heating up the device and reaching the final thermal equilibrium of the hot junction, we shall reach the final junction temperature, that is, after a transition from a cold steady state to a hot steady state (or vice versa). This procedure - also known as the static test method - suggests another reformulation of eq. (1). Suppose, in the initial steadystate a known PH1 heating power is applied, while in the final steady state another known heating power PH2 is applied. For both cases we can express the junction temperature based on the pattern of eq. (1):
Subtracting (3a) from (3b) we obtain
In eq. (4) we can also indicate that Tj1 and Tj2 junction temperatures occurred at different time instances:
Substituting these and rearranging (4) yields
In other words, instead of using a spatial temperature difference along the junction-to-X heat-flow path, eq. (6) suggests that the ‘thermal resistance’ as a metric can be calculated from the difference of the initial and the final steady state value of the junction temperature, provided the change of the heating power at the junction is also known and the reference temperature is kept constant, see also Figure 2. In other words: instead of the difference of temperature at two different locations (spatial difference) we take the temporal difference of the junction temperature only. A major advantage of the differential approach represented by eq. (6) is that inaccuracies in junction temperature measurement cancel out. In case of power LEDs this formulation helps to eliminate some concerns about the thermal resistance (as raised in [1] and [2]), but still questions about the definition and measurement of the junction temperature as well as the heating power dissipated within the device need to be dealt carefully.
The junction temperature and the junction-to-X thermal resistance serve different purposes for both system designers and device manufacturers. The goal of component designers (manufacturers) is to achieve better thermal performance of the device and to establish figure-of-merit values for comparison with other vendors’ products. Typically junction-to-X thermal resistance values are used for such purposes. The junction-to-X thermal resistance values are usually the only input data for (lighting) system designers who want to study whatif scenarios and want to obtain sufficiently accurate prediction of Tj through which other important properties of LEDs can be also predicted. Since LEDs are rather complex in their operation (suggested by Figure 1), standardized multi-domain (thermal, electrical and optical) models would be required to predict operation of any vendors’ LEDs. Outlines of such a model are given in the Appendix.
Goals of LED Thermal Characterization: Reliability and Performance Prediction
The most important reason to use thermal data for an LED-based product design is to get an idea about the reliability of the final product (apart from adhering to official regulations such as UL8750). It is useful to make a distinction between the device (the LED itself) and the package or system:
• Device reliability: intrinsic light output reduction under operating conditions.
• Package reliability: failures caused by thermal stresses and ageing.
Device level reliability issues
The main temperature-related problem at the device level is reduction in light output as a function of time. Because of this phenomenon, the light output may decrease to an unacceptable level before a ‘real’ irreversible failure occurs. This condition may be coined a ‘lumen maintenance’ failure. The level at which this is called a ‘failure’ should be subject to standardization (but this is beyond the scope of this paper). Note however, that in recent years, the gradual reduction in light output over time has been improved quite significantly.
Despite this progress, or maybe even because of this, a customer may still want to know what happens when the LEDs are driven outside the recommended range, as happened in the IC world (uprating).
From the point of view of different possible failure mechanisms, it is typically the absolute junction temperature which plays a key role. In practice the question remains how to measure the temperature with the required accuracy.
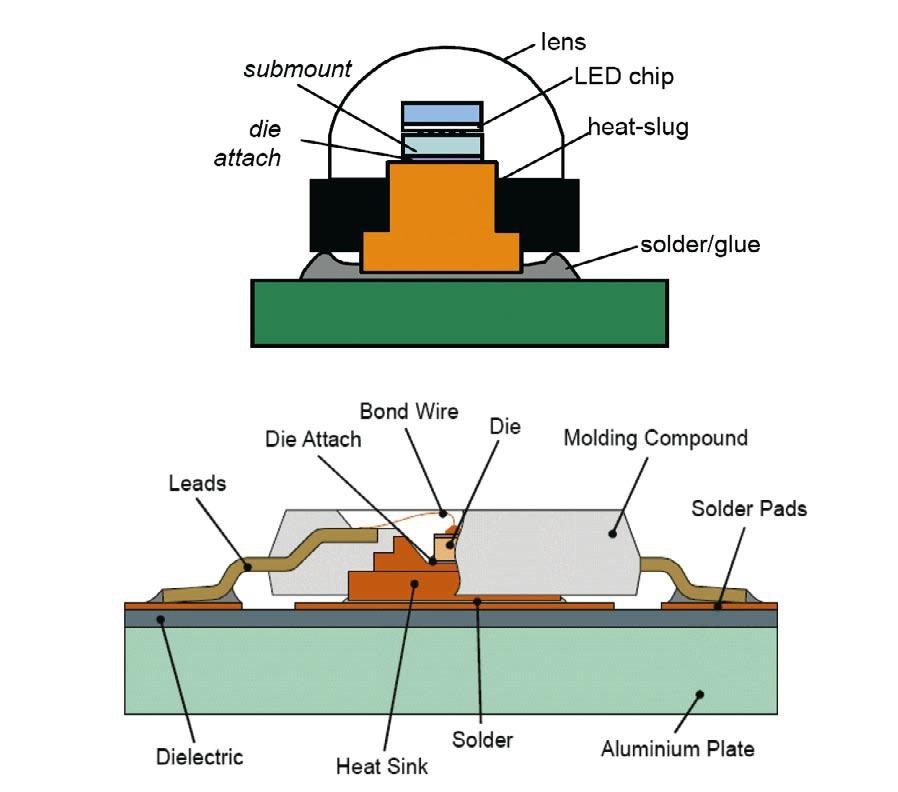
Let us now focus on package reliability with its many faces. Sketches of two packages containing LED dies are shown in Figure 3.
A few degradation and failure mechanisms that are worth mentioning are:
• yellowing of phosphor containing encapsulations.
• lens degradation.
• delamination of adhesive layers.
• solder joint failures.
One should note that for high-quality LEDs these degradations usually only occur when operating outside rated conditions. LEDs suffer also from current-dependent failure mechanisms, such as electromigration and Joule heating that cause excessive local temperature rise in currentcarrying tracks and wires. For further reading on LED reliability issues please consult references [5], [6], [7], [8], [9], [10] and [11]. In summary, most of the degradation and failure mechanism that rule the lifetime of a LED-based product are temperature assisted failure mechanisms. Consequently, in order to estimate lifetime, designers need reliable information about the expected temperature profile over time.
System reliability
As is the case in the IC world, we have two separate reliability issues: one at the component level, one at the system level. While at the component level we can live with quoting data under specified conditions, we need at the system level data reflecting operating conditions. The ‘translation’ of component level to system level is the subject of the following section.
Drawbacks of Current Data Sheets
Important features a designer of an LED-based product wants to know are luminous flux (lumen) and efficacy (emitted luminous flux per supplied electrical power, aka lumen/W), not only at zero-hour but also over the expected lifetime of the LED based lighting system. The problem is that both key parameters are not linearly related to driving current and temperature. Hence, it is not sufficient to report data only at some optimistic temperature. The question is: how bad are most of the current data sheets? The answer is: pretty bad, at least from the perspective of the experienced designer, for the following reasons (see also Grabher-Meyer [12]):
• Data sheets do not reflect real-life operation, especially regarding operating temperature. Often Tj specified at 25°C → misleading, efficacy at maximal rated power can be 50% lower.
• They differ strongly in content (Tref , Iref).
• Often a direct comparison is not possible.
• While non-thermal but temperature-related: translation to useful lumens or non-nominal use is not ‘idiot’ proof, and even for an experienced designer not an easy task.
• The way of quoting thermal data by manufacturers via the series thermal resistance approach may be questioned in a number of practical cases as will be shown further on.
On the positive side: it should be noted that there is a tendency among the leading LED suppliers to improve upon this situation and some have started to quote values that are more realistic.
Examples of problems with current datasheets
▪ The definition of power
Although most LED vendors perform thermal testing according to the EIA/JEDEC JESD51-1 standard, they consider the PH power of eq. (2) in a sloppy way. The standard clearly mentions “power dissipated in the device” (Measurement basics, page 3 of reference [4]) and does not give any definition how to calculate it. For silicon diodes there is no doubt that PH = IF* VF (the electrical power supplied to the diode calculated as the product of the total forward current and the forward voltage) while in case of LEDs an energy balance must be considered when calculating the power dissipated in the device.
In case of high power LEDs the current component associated with radiative recombination (giving rise to light output) represents a significant percentage of the total forward current If, consequently, the IF* VF product does not represent the heat dissipated in the device (at the junction): the portion of IF associated with radiative recombination must not be included when calculating the heat dissipation of an LED, since the related energy leaves the LED in form of light.
Maybe the biggest problem nowadays hampering a fair comparison is that vendors do not consider the light output when calculating the heating power of their LEDs. Many manufacturers define their power dissipation by the product of the forward voltage and the total forward current only, not taking into account the efficiency of the conversion from current into light. This results in an unfair marketing disadvantage for those vendors who honestly consider the principles of physics during their thermal measurements.
To highlight this, let us compare two simple cases to address the consequences, and let us define Rth el as the thermal resistance based on the total supplied electrical power Pel = IF*VF only, and quantity Rth real as the real thermal resistance of the LED package based on the real issipation which is PH = Pel -Popt = Pel * (1-WPE) where WPE stands for wall-plug efficiency and it is calculated as the ratio of the supplied electrical power and the emitted optical power of the LED: WPE = Popt/Pel. The Popt emitted optical power can be measured at well defined IF forward current and Tref reference temperature values as the total radiometric flux Φe (IF ,Tref) of the LED, using the procedures recommended in the CIE 127-2007 document [13].
A thermal metric of an LED called ‘thermal resistance’ should only be related to the physical properties and the geometrical dimensions of the chip and the package. The problem in practice is that the users should know the WPE efficiency as well if they want to.
Of course the LED community could decide to continue using a metric based on the total electrical power input only, resulting in the same LEDs differing only in efficiency to get different Rth's and maintaining the unfair situation among vendors offering devices with different power conversion efficiencies. However, to prevent confusion, we should not call such a metric as an Rth, but in analogy with IC thermal standardization maybe it should be denoted as ψ. The only benefit of this ψ is that the user does not need to know the efficiency, but could derive it more or less from comparing two quoted values, with the emphasis on ‘more or less’. On the other hand, a higher efficiency is an important sales argument with the increasing interest in sustainability, and hence it makes sense to report this parameter on the data sheets too.
As shown in Figure 4, the overall efficiency (denoted as WPE before) depends on temperature and current. This of course also results in the current and temperature dependence of the efficacy which is nothing else than the WPE weighted with the V(λ) visibility function defined by the CIE. This is the reason why any metric of an LED reported in a data sheet should also be reported together with the current and temperature at which the given metric was identified. Furthermore, to allow system level designers using data sheet values, it is not sufficient to present efficacy information only, but energy conversion efficiency should also be provided by LED vendors. The value of the forward current to report is unambiguous but the definition of the temperature value to report needs careful discussion. In an ideal case, this must be the junction temperature provided there is an unambiguous way to identify the absolute value of the junction temperature of the LED in practice.
See Figure 5 (see LpR magazine)
▪ The series thermal resistance approach
As an example of the problems that are associated with a series resistance approach let us have a look at the data sheets of one of the major LED manufacturers. Figure 5 presents a sketch taken from a typical application brief.
The assumptions underlying the series resistance approach are the following:
• The heat generated at the junction follows the path sketched via the thermal pad, board/heat sink and finally the ambient.
• The resistances are defined locally, in other words, the thermal resistance from die to heat slug is only dependent on local parameters.
• Consequently, the individual resistances are independent of each other. For example, the thermal resistance from die to heat slug is neither dependent on the board thermal conductivity, nor on the heat transfer coefficient. This may sound trivial, but it is possible to define a series resistance network of which the resistors are dependent on each other. This principle is underlying the well-known heat spreading approach proposed e.g. in [14].
In order to check the validity of these assumptions, a Luxeon Rebel as depicted in Figure 6 was modeled on a board using a CFD code in conduction-only mode.
See Figure 6 (see LpR magazine)
The procedure to check was as follows. Various parameters such as board thermal conductivity and heat transfer coefficient were varied over a wide range for the purpose of illustration, and the values of the thermal resistances were calculated according to the Application brief mentioned. The graphs in Figure 7 show the essential results.
At the top, Rth die-thermal pad should be only dependent on the dimensions and the thermal conductivity of the thermal pad, not on the thermal conductivity of the board and the heat transfer coefficient. Over the whole range, there is a variation of 15% that seems acceptable for most practical applications. The bottom graph shows Rth thermal pad-board as a function of its thermal conductivity and h. In this case, this Rth should be proportional to kboard and independent of h. It is clear that we meet a problem when the effective board conductivity becomes smaller than about 5K/W because the values of the published resistances become a function of the application and as such cannot be used with confidence, unless the application does resemble more or less the measurement conditions.
See Figure 7 (see LpR magazine)
This situation is the consequence of heat spreading, where it is impossible to separate the conduction and convection parts. In other words, a series resistance approach can never result in a boundary condition independent thermal model. However, there are exceptions. For many high-power LEDs the lateral temperature gradients can be neglected. In these cases it can be shown that the series resistance approach is valid. For example, for state-of-the-art high-power LEDs the lower limit of 0,3K/W in the graph is not realistic [15]. It should also be noted that not in all cases a correct value of some resistances is mandatory because these resistances may not be dominant in a real application. Often it turns out that the resistance to ambient is dominating, hence, errors in the published data are not critical.
In summary, while it may be argued that especially for high-power LEDs the series resistance approach does describe the physics correctly, it is also true that we need thermal standardization protocols to address the accuracy of the series resistance approach for every possible application.
Other Questions a LED Thermal Standardization Body Should Address
Apart from the problems with the current data sheets, many other thermal characterization issues also pose challenges. The topics listed below deserve a position on the standardization agenda:
▪ Basic questions
• For all parties involved: what is needed in terms of standards and guidelines? It seems that at the device level the basic definitions of the most relevant measurement standards (EIA/JEDEC JESD51-1 [4], CIE 127-2007 [13]) are applicable to high power LEDs, with additional guidelines. For example, the wording of JESD51-1 about “power dissipated in the device” might be completed by guidelines providing a correct interpretation for LEDs. Guidelines regarding test conditions specific to LEDs might also be needed.
• What do the manufacturers want as a fair and reliable thermal metric to compare products? During the panel discussion at the 14th THERMINIC Workshop in September 2008 in Rome there was an agreement among participants that the quantity denoted as Rth real was acceptable.
• What do trained end-users want, and can this be realized by the manufacturers? The above panel discussion concluded the following:
• A component datasheet should contain sufficient and reliable data to be able to predict performance and reliability of the system.
• Datasheet values should have relevance for any application (such as compact thermal models for electronic devices).
• Not only thermal performance but also the thermal link to optical performance and reliability should be described, e.g. besides efficacy, efficiency should also be reported.
• What links with other international standardization bodies or national measurement laboratories would be required and how can proper co-operation between the various standardization bodies be warranted? It is desired to coordinate the work of different standardization bodies to avoid multiple and inconsistent definition of the same quantity and the related measurement procedure.
▪ Thermal measurement-related questions
• What are the pros and cons of steady-state vs. transient measurements in LED test conditions? There is a one-to-one correspondence between steady-state value obtained from transient thermal measurements and the original definition of the thermal resistance as per JEDEC JESD51-1. During the above-mentioned panel discussion it turned out that the leading LED vendors represented in the panel obtain their steady-state thermal metrics of LED packages from transient measurements following the scheme shown in Figure 2. Note, that realizing measurement of thermal resistance according to eq. (6) does not involve any expensive transient test equipment. The only assumption in relation to eq. (6) is that the reference point temperature is kept constant.
• How to measure the ‘thermal’ power? In theory, this may be based on the measurement of the total luminous flux Φv and the relative spectral distribution (RSPD) of the LED, or one may try to measure the total radiometric flux Φe of the LED (using a photo detector having a flat spectral response). In practical realizations, the second approach is more feasible. One should be careful when selecting these methods: whatever type of total flux is measured, the measurement should be calibrated to a standard LED which possesses a similar relative spectral distribution as the LED under test. Photometric detectors are less sensitive at the edges of the visible spectrum (since the V(λ) function vanishes both at the blue and red end of the visible spectrum). In case of a flat response (radiometric detectors) the physical limits come from the spectral distribution of the sensitivity of the detector in use. In case of Si based detectors, cut-off of the detector starts at blue. When implementing the total (radiometric) flux measurement of LEDs, the relevant recommendations of the CIE must be followed [13]. An early solution for correcting the LEDs’ dissipation with the emitted radiometric flux is suggested in two papers by Farkas et al. [16], [17].
• How to measure the case temperature? Power LEDs can be best characterized on a cold-plate. Then, though we do not have the case temperature itself, we have quite accurate information about the cold-plate temperature. The interfacial layer between the cold-plate and the heat-slug should be addressed. Detailed information about the junction-to-ambient heat-flow path can be extracted from thermal transient measurements - providing an option to address the thermal interface resistance as well as allowing calculation of the junction temperature based on the known reference temperature.
• How to deal with non-uniform and non-unique die temperatures? Probably we need a test method to guarantee some unique average, akin to the JEDEC JESD51-1 electrical test method. So far for LED thermal testing solutions the electrical test method is being used. Problems arise when multiple LED chips - connected electrically in series - are inside a package. In this case the electrical test method results in an ‘ensemble’ junction temperature. Unless individual access to each die is not provided, this problem cannot be overcome. Die temperature non-uniformity can be studied by simulation - this way measured and simulated data can be correlated. As an alternative to the JEDEC JES51-1 electrical test method IR thermography might also be considered.
• How to tackle multi-sources? This not only a measurement problem but also a data representation problem. Single source compact modeling approaches cannot be used. A matrix representation is probably the preferred option. For LED applications, see e.g. papers by Zhang and Treurniet [18], Treurniet and Lammens [19], and Poppe et al. [20]. One has to note that we can measure the elements of the matrices only if access to every individual LED chip is provided - i.e. if the LED based system was also designed for thermal testability. If there is no individual (preferably 4-wire) access to all the LED chips of the device under test, we can measure only an overall average junction temperature and we run into the problem of the ‘ensemble’ junction temperature and ‘ensemble’ thermal resistance problem as discussed already in relation to the junction temperature.
• How to deal with phosphor-encapsulated dice? These pose extra problems, caused by absorption of light resulting in an extra heat source away from the junction. Information about the absorption and the spatial distribution of the heat generation would be rather difficult to obtain. On top of this, we would have a system with multiple heat-sources where only the dissipation at the junction could be controlled, so one would not be able to measure the elements of the matrix of the junction-phosphor multi-heat-source system. Consequently, the extra heat originating from the phosphor would disturb somehow the measurement of the thermal properties seen from the junction and there is no method available to measure this distortion. Again, a possible work¬around could be proper numerical simulation, but we believe this should remain the task of the LED manufacturers.
• What about pulsed-type thermal measurements? Due to several reasons, they are probably to be avoided (referred to as the dynamic test method in the JEDEC JESD 51-1 document). One reason is that such measurements cannot be combined with CIE 127/2007 compliant total flux measurements. To assure consistency of thermal metrics and optical metrics, combination JEDEC JESD51-1 static test method compliant thermal measurement and CIE 127-2007 compliant total flux measurement seems to be the only feasible way.
• How to relate the short-pulse results to properties that can be measured under steady-state operating conditions? In production testing, properties of LEDs are measured by short pulses at temperatures that do usually not represent the actual operating conditions. To tackle this problem, details of the complex LED behavior are required. Obviously, the answers to these questions are by no means trivial and are best approached by collecting relevant information from all parties involved. Fortunately, many issues could benefit from the work that has already been done in the IC world. There are two considerations that mitigate the problems compared to the situation we faced 20 years ago with IC packages: from a thermal modeling point of view LED packages are a lot less complex than for example microprocessor packages, and we have all the experience from the past including many standardization templates. On the other hand, it might turn out that thermal-only models are not sufficient for LEDs and electro-thermal-optical multidomain models may be the preferred solution.
Proposal for Action
For LED-based products a plethora of standardization bodies, such as ANSI, IESNA, CIE, FCC, IEC, NFPA, UL, NIST, NEMA, CSA, can be noticed. Many standards that will be generated through these bodies are related to temperature. The logical choice for the thermal standardization body is JEDEC because ICs and LEDs have many things in common. The charter of the JEDEC JC15.1 committee reflects this commonality:
• Generation of thermal measurement and modeling standards for packaging.
• The standards shall be meaningful, consistent and scientifically sound.
• The standards will provide a common means of comparison of thermal phenomena for users of packages.
For a presentation about thermal characterization in general including the roadmap see Guenin [21], showing that standardization of ICs covers not only the test methods but also related topics such as compact models and interface resistances.
While for IC packages we decided to start with end-users only, it seems a better option now to establish a consortium consisting of all parties involved: end-users, LED manufacturers, system manufacturers (luminaries), software developers and test equipment manufacturers, simply because we are not starting from scratch. One obvious approach (given the successes of IC thermal characterization in the past) could be a cooperation of partners such as Philips SSL, Lumileds Europe, Osram, Mentor Graphics MicReD, Technical University of Budapest (BME), GE Lighting Europe, others. Such a consortium, preferably within the framework of some public or industry funded project, should tackle the technological issues and prepare proposals for subsequent discussion within JEDEC.
Steps taken so far include forming a task group in JEDEC JC15.1 committee to deal with the topic. CIE has also form two new technical committees (TCs) dealing with thermal issues related to LED testing. In these TCs a JEDEC JC15.1 committee member is also involved which might ensure coherent recommendations by both standardization bodies.
Conclusions
The paper shows that the current data sheets should be improved from the perspective of both the manufacturers and the system designers. A proposal for action is formulated, essentially comprising the formation of a consortium in which all parties involved participate.
Key considerations:
• Without standards and guidelines, manufacturers who cannot resist swindling have a competitive edge, creating burned soil for the manufacturers who are at least willing to provide their customers with useful thermal data.
• When manufacturers do not take the initiative, end-users are going to demand reliable thermal data for their applications at some moment in time. The manufacturer who can provide these data in time has a competitive edge.
• LED thermal metrics are not only required for reliability and lifetime prediction but also for proper lighting design because all aspects of light output are highly temperature dependent.
• The JEDEC JC15.1 thermal standardization committee is the logical choice to address the complex issues related to thermal modeling and testing standards.
• To define proper standards, manufacturers of components, systems, software and test equipment together with system designers should cooperate, possibly within the framework of an EU-funded consortium.
